PSRIO - v0.24.0
Introduction
PSRIO is a business intelligence tool developed by PSR that enables users to transform, analyze and visualize data to facilitate better decision-making. It is a scripting language developed on top of the LUA, designed to query data held in PSR databases and perform user-specified mathematical, statistical, and data processing operations, producing customized outputs in the same format as the SDDP outputs. PSRIO automates and standardizes everyday operations by delegating tasks to an easy-to-use and secure language, reducing manual errors and repeated work.
The benefits of PSRIO include the direct creation of web-format dashboards, allowing users to access their dashboards on the go. PSRIO offers a simple interface for end-users to create their outputs and dashboards, making using the service easily. The scripting language is flexible and efficient, providing a faster cycle of "edit-run-test".
PSR + LUA Scripting + Dashboards = PSRIO
PSRIO is built on LUA, a powerful and widely-used scripting language designed by Roberto Ierusalimschy, Luiz H. de Figueiredo, and Waldemar Celes at Tecgraf/PUC-Rio. LUA is known for being a simple yet powerful language for embedding and extending applications. Using LUA avoids common low-level programming language errors, such as stack overflows.
PSRIO Editor and PSR Models Integration
PSRIO also offers a built-in editor that allows the creation, customization, and execution of recipe files. Recipe files are user scripts saved in the case directory and automatically processed after SDDP completes the execution. PSRIO's integration with Graph 4 allows users to create complete, beautiful, and customizable dashboards.
Using traditional tools such as Excel or custom-made routines for processing specific files can be laborious, repetitive, and error-prone. Additionally, these tools bring limitations related to scalability due to the increase in the volume of results originating from the greater complexity and detail embedded inside PSR models. PSRIO complements the PSR's processing and visualization toolkit by providing a fast, customizable, and highly user-friendly way to process and visualize data, enabling users to make better decisions.
Support or Contact
If you have any issues or questions, PSRIO offers support via sddp@psr-inc.com.
Getting Started
Creating a PSRIO Script
In this guide, we will show you how to create PSRIO recipes from scratch using output data from example cases inside the SDDP installation folder. For the purpose of this tutorial, we will use example case 20, which consists of a single system with three thermal plants supplying energy to consumers over 12 stages, with deterministic execution.
Example
To calculate the average demand marginal cost over the study horizon from the cmgdem.csv file, we first load the system collection with the following command:
system = System();
Then, we load the marginal cost data from the file:
cmgdem = system:load("cmgdem");
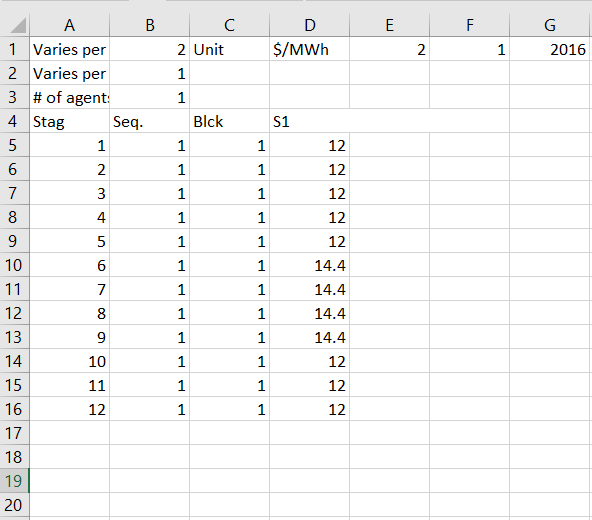
The data can be seen in the image below:
The processing is accomplished using the method aggregate_stages, with the parameter BY_AVERAGE():
cmgdem_avg = cmgdem:aggregate_stages(BY_AVERAGE());
We save the expression with the following method, and the PSRIO will output the cmgdem_avg.bin and cmgdem_avg.hdr.
cmgdem_avg:save("cmgdem_avg");
If we want to save a CSV file, we should use the additional parameter:
cmgdem_avg:save("cmgdem_avg", { csv = true });
Let's see what the final result looks like:
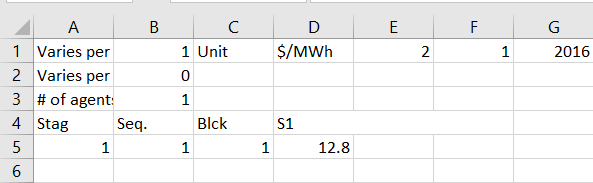
As we can see, the stages collapsed into one single value representing the average value of the demand marginal costs over the study horizon.
Example
Suppose we want to extract the total amount of energy generated by the plants based on the information received from SDDP about the generations in each stage of each plant, which we found in the file gerter.csv. First, we load the thermal collection with the following command:
thermal = Thermal();
Then, we load the thermal generation data from the file:
gerter = thermal:load("gerter");
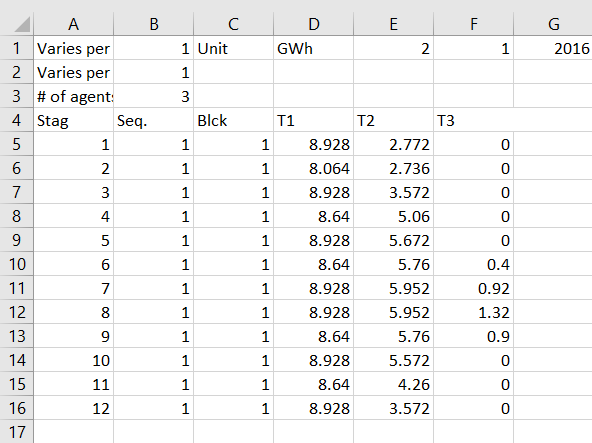
Check the data contained in the file:
Notice that we managed to load the generation data by informing the output filename. Now, we can make operations with the thermal generation data. We want to sum the values of each plant regarding one stage so that there is only one value per stage representing the total generation of the system.
total_gerter = gerter:aggregate_agents(BY_SUM(), "Total thermal");

total_gerter:save("total_gerter", { csv = true });
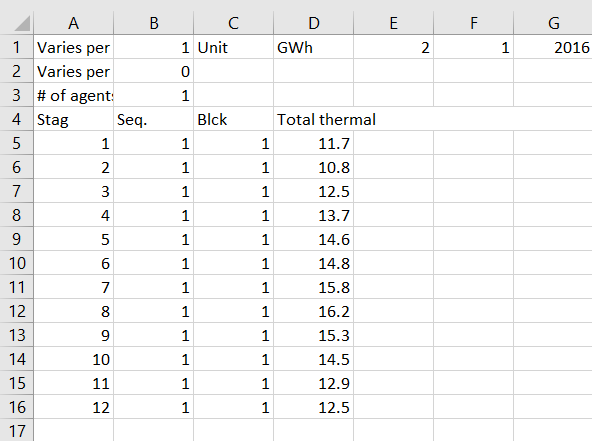
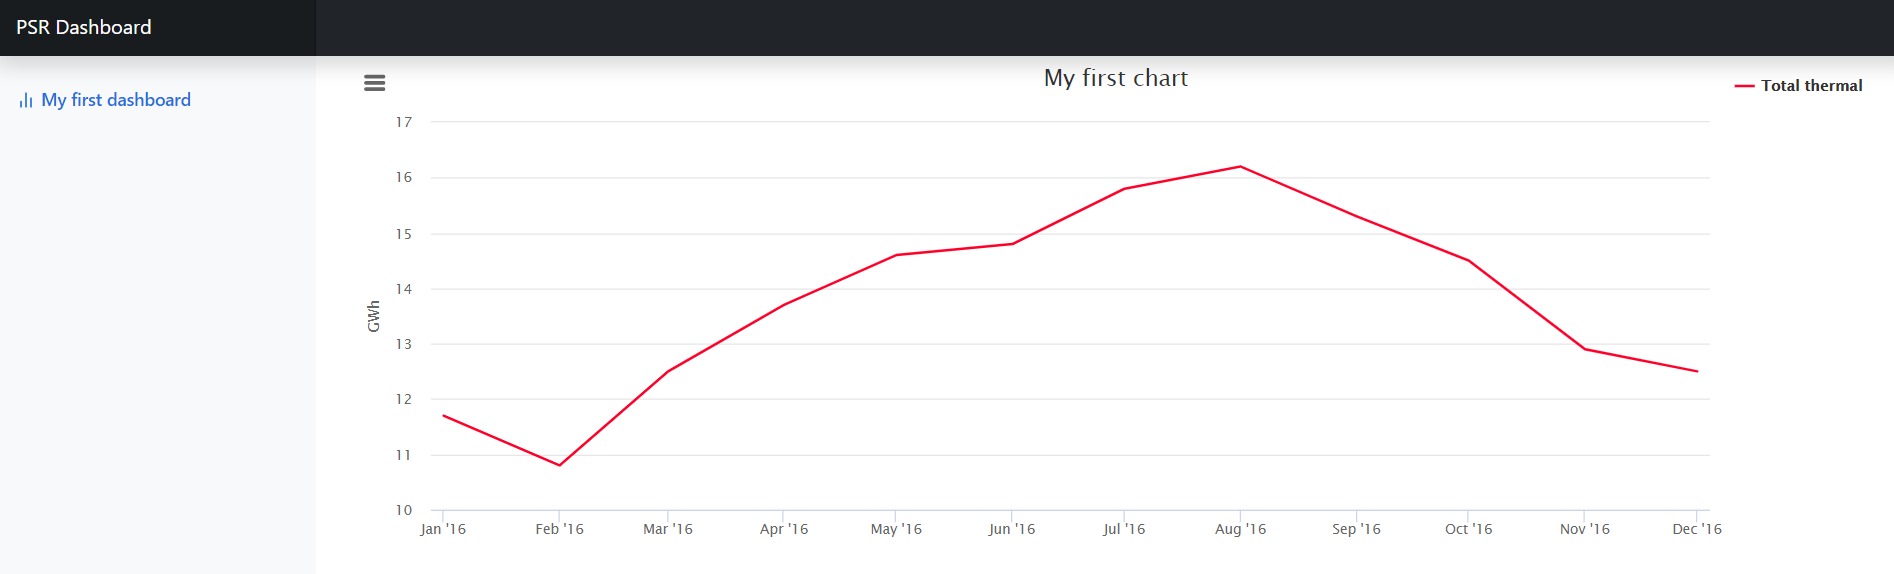
The first instruction is to aggregate agents, summing their respective generations for each stage. In the subsequent command, we are saving the data stored in the variable total_gerter to the file total_gerter.csv. The processed data looks like this:
The best way to visualize the output is by plotting the data, making one of them. First, let’s define an object for the chart.
chart = Chart("My first chart");
We indicate to the chart object that we want to plot the data in the file variable total_gerter, which we have just created.
chart:add_line(total_gerter);
After that, we will define a tab object to hold chart objects information and then add the chart and save it to the file thermal_report.html.
tab = Tab("My first tab");
tab:push(chart);

dashboard = Dashboard();
dashboard:push(tab);
dashboard:save("thermal_report");
By clicking in the file thermal_report.html, that's what we get:
In short, the recipe for this work is as follows:
-- Load thermal collections and thermal generation data
thermal = Thermal();
gerter = thermal:load("gerter");

-- Aggregate agents generations by sum and save to output file
total_gerter = gerter:aggregate_agents(BY_SUM(), "Total thermal");
total_gerter:save("total_gerter", { csv = true });

-- Create chart object
chart = Chart("My first chart");

-- Add total generation info
chart:add_line(total_gerter);

-- Create dashboad object
tab = Tab("My first tab");

-- Add chart and save to html file
tab:push(chart);
tab:save("thermal_report");
There are two ways to run the script above-mentioned. In the following sections, we will explain each one of them.
Running a script
Graph 4
Graph 4 is a powerful graphing tool that allows users to make PSRIO scripts within an editor. Once the SDDP execution is complete, you can open Graph 4 by following these steps:
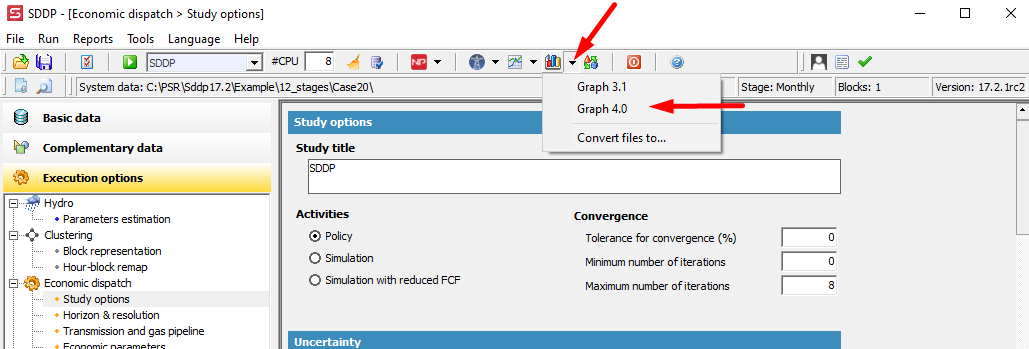
Select the PSRIO editor option from the menu on your screen's left side:
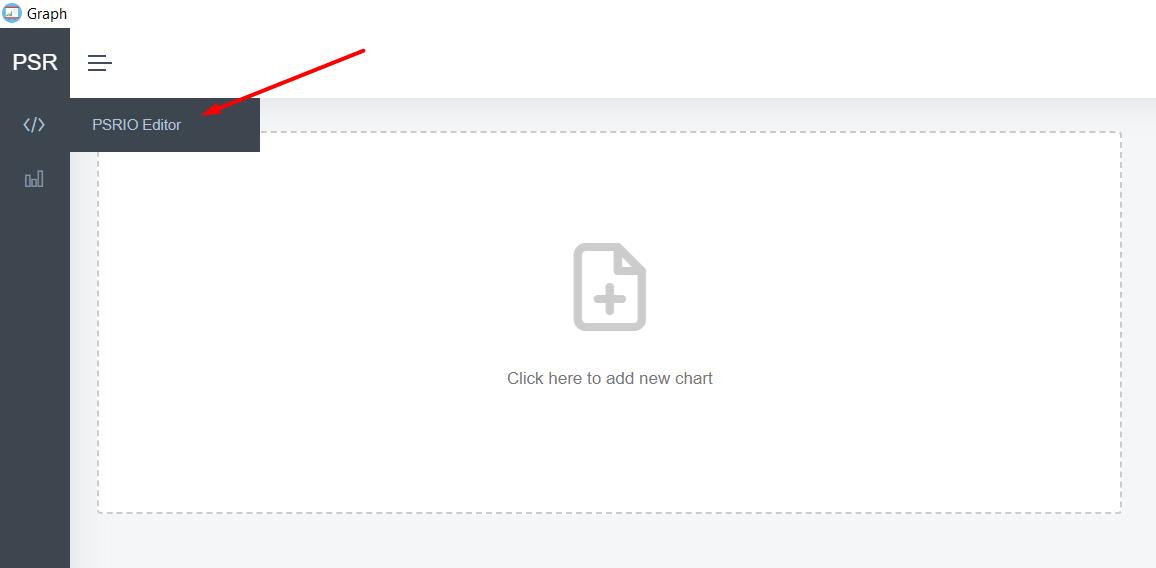
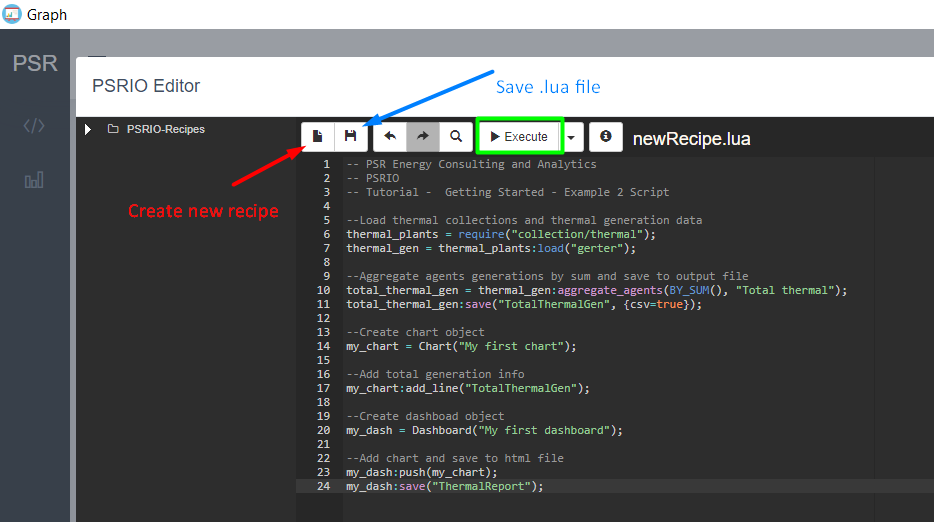
You can create a new script, write down the code, save it, and you will be ready to go:
SDDP
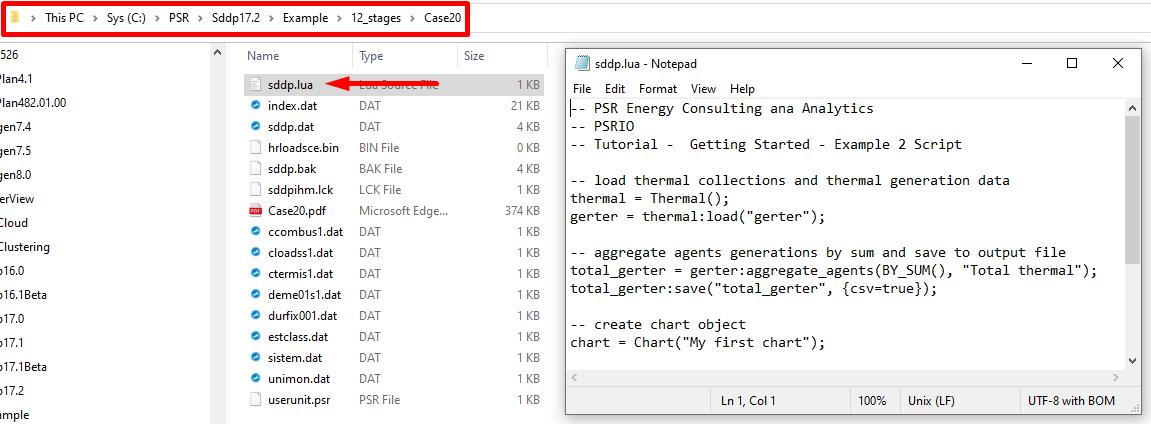
Another way to run a PSRIO script is by using SDDP. You can automate running a PSRIO script by saving an sddp.lua file in the case folder. The SDDP model will run this script and produce the outputs and tab defined on it.
By following either of these methods, you can easily run the script and get the desired outputs.
Changelog
0.24.0 (2023-05-12)
https://psrio.psr-inc.com/0.24.0/index.html
Added
- improved ncp integration
chart:add_box_plot(...)dashboard:set_refresh_rate(...)toml:get_integer_array(key)exp:select_agents(collection)when exp is from a generic collectionexp:uncouple_blocks(clear_first_data)exp:uncouple_stages_blocks()exp:uncouple_stages_blocks(clear_first_data)exp:spread_hours()exp:aggregate_broadcast_blocks(f, profile)- collection length operator:
#collection --upload_dashboardsargument (require AWS_ACCESS_KEY_ID and AWS_SECRET_ACCESS_KEY)--incremental_progress_barargumentcircuit_flow.lua,thermal_operation.luaandthermal_dispatch_factor.luahydro.min_total_outflow_hourlyhydro.max_total_outflow_hourlyhydro.min_operative_storage_hourlyhydro.max_operative_storage_hourlyhydro.flood_control_hourlyhydro.alert_storage_hourlyhydro.min_spillage_hourlyhydro.max_spillage_hourlyhydro.min_bio_spillage_hourlyhydro.target_storage_hourlyhydro.max_turbining_hourly
Syntax Changes
toml:get_array_size(...)totoml:get_table_array_size(...)toml:get_array(...)totoml:get_table_array(...)thermal_generation_running_hours.luatothermal_plant_running_hours.luaconcentratedsolarpower.hour_generationtoconcentratedsolarpower.hour_scenarios
Changed
- if the binary expression relationship can not be found, try the other way around
collection:load_tableandcollection:load_table_without_headerbehavior when the file does not exist; now return an empty table
Fixed
- binary expression relationship issue that occurred when the collection consisted of only one agent
- missing trim in collection:load_table(...)
chart:add_probability_of_exceedance(...)andchart:add_probability_of_exceedance(...)last point (100%)collection:load_table_without_headerloading (#133)- issue that occurred when attempting to save a dashboard or report within a nested folder
- error that occurred while running a script with a report in dependency mode
Removed
Dashboard("title")dashboard + dashboardoperatordashboard:push(dashboard)dashboard:push(chart)dashboard:push(markdown)area.importedarea.exportedcircuit.international_cost_rightcircuit.international_cost_leftdclink.capacity_rightdclink.capacity_leftfuelcontract.max_offtakeinterconnection.capacity_rightinterconnection.capacity_leftinterconnection.cost_rightinterconnection.cost_leftrenewable.hour_generationrenewable.block_generationrenewable_gauging_station.hour_generationrenewable_gauging_station.block_generationrenewable_gauging_station.hour_historical_generation
Submodules
- Bootstrap Icons
1.10.2->1.10.4 - fast_float
3.10.0->4.0.0 - GitHub Flavored Markdown
0.29.0.gfm.9->0.29.0.gfm.11 - PSRClasses
62b06eab->5ce7fe6e
Changelog
0.23.0 (2023-04-03)
https://psrio.psr-inc.com/0.23.0/index.html
Added
- loading overlay in dashboard (#106)
HydroGaugingStationcollection (alias toGaugingStation, to be deprecated in the future)collection:avids()relational:add(header, vector)exp:spread_stages(int)exp:replace_scenarios(src, {int, int, ...})study:stages_without_buffer_years()andstudy:buffer_stages()hydro.storage_x_elevation__storage_1, ...,hydro.storage_x_elevation__storage_5hydro.storage_x_elevation__elevation_1, ...,hydro.storage_x_elevation__elevation_5
Changed
BY_PERCENTILE(p)to be the same as Excel PERCENTILE.EXC
Fixed
fuel.emission_factorcollection:labels()--magentintermittent error
Removed
writer:open(), now the open function is called in the constructor
Submodules
- PSRClasses
c72d7788->62b06eab
Changelog
0.22.0 (2023-03-09)
https://psrio.psr-inc.com/0.22.0/index.html
Added
- new aws s3 saving implementation
exp:aggregate_scenarios_blocks(f)exp:aggregate_topology(f, topology, min_level, max_level)chart:add_heatmap(exp)chart:add_column_range(exp, exp)chart:add_error_bar(exp, exp)chart:set_digits(int)andtimeseries:set_digits(int)chart:add_probability_of_nonexceedance(...)Topology.SPILLED_FROM--load_only_csvargument
Syntax Changes
Collection.DCLINKtoCollection.DC_LINK
Changed
- improved heatmap rendering performance
- improved the significant digits in the fast_csv
collection:labels(),collection:codes(), andcollection:inputs()now it returns a table
Fixed
- error in
collection:get_files(...)andcollection:get_directories(...)when the directory does not exist - error when trying to save data in a subfolder (#93)
- error loading netplan bases
- error when converting units with negative stages (#96)
Removed
chart:add_heatmap_hourly(...)- awsintegration
Submodules
- fast_float
3.8.1->3.10.0 - GitHub Flavored Markdown
0.29.0.gfm.7->0.29.0.gfm.9 - Github Markdown CSS
5.1.0->5.2.0 - PSRClasses
1ce193dd->66c9973f - PSRPlot
0.4->0.7
Changelog
0.21.0 (2023-01-16)
https://psrio.psr-inc.com/0.21.0/index.html
Added
- NCP support
exp:aggregate_blocks()with automatic aggregation function selectionGenericConstraintcollectionexp:map_scenarios(filename)--load_from_output_pathreading incollection:load_toml(...)dashboard:set_title(string)generic:create_writer(filename)writer:open()writer:is_open()writer:write(string)writer:write_line(string)writer:close()--log_appendargument
Syntax Changes
--lognameto--log_nameargumenttoml:get_bool(...)totoml:get_boolean(...)toml:get_int(...)totoml:get_integer(...)toml:get_double(...)totoml:get_real(...)
Fixed
- intermittent error in
Loadcollection relational:add(string, study, from, to)when the collection is empty- error in
aggregate_stages whenfirst_stage > 1` (#86) - error using
aggregate_stages(..., Profile.PER_WEEK)when exp has weekly stages (#89)
Removed
- some trace messages
- loadfile and dofile functions
Submodules
- PSRClasses
07a23f47->1ce193dd
Changelog
0.20.0 (2022-12-23)
https://psrio.psr-inc.com/0.20.0/index.html
Added
study:has_flexible_demand()study:has_hourly_renewable_scenarios()
Syntax Changes
- all base functions now receive the study index, ex:
sddpgrxxd(i, suffix) battery.existingtobattery.statefuel_reservoir.maxinjectiontofuel_reservoir.max_injectionfuel_reservoir.maxinjection_chronologicaltofuel_reservoir.max_injection_constrainthydro.min_total_outflow_penaltytohydro.min_total_outflow_unit_violation_costhydro.max_total_outflow_penaltytohydro.max_total_outflow_unit_violation_costhydro.min_operative_storage_penaltytohydro.min_operative_storage_unit_violation_costhydro.max_operative_storage_penaltytohydro.max_operative_storage_unit_violation_costhydro.alert_storage_penaltytohydro.alert_storage_unit_violation_costhydro.min_spillage_penaltytohydro.min_spillage_unit_violation_costhydro.max_spillage_penaltytohydro.max_spillage_unit_violation_costhydro.min_bio_spillage_penaltytohydro.min_bio_spillage_unit_violation_costhydro.min_turbining_penaltytohydro.min_turbining_unit_violation_costhydro.max_turbining_penaltytohydro.max_turbining_unit_violation_costhydro.min_total_outflow_penalty_typetohydro.min_total_outflow_violation_typehydro.max_total_outflow_penalty_typetohydro.max_total_outflow_violation_typehydro.min_operative_storage_penalty_typetohydro.min_operative_storage_violation_typehydro.max_operative_storage_penalty_typetohydro.max_operative_storage_violation_typehydro.alert_storage_penalty_typetohydro.alert_storage_violation_typehydro.min_spillage_penalty_typetohydro.min_spillage_violation_typehydro.max_spillage_penalty_typetohydro.max_spillage_violation_typehydro.min_bio_spillage_penalty_typetohydro.min_bio_spillage_violation_typehydro.min_turbining_penalty_typetohydro.min_turbining_violation_typehydro.max_turbining_penalty_typetohydro.max_turbining_violation_typerenewable.hour_generationtorenewable.hour_scenariosrenewable.block_generationtorenewable.block_scenariosrenewable_gauging_station.hour_generationtorenewable_gauging_station.hour_scenariosrenewable_gauging_station.block_generationtorenewable_gauging_station.block_scenariosrenewable_gauging_station.hour_historical_generationtorenewable_gauging_station.hour_historical_scenarios
Changed
- disabled tab behavior when there are sub tabs
Fixed
exp:to_hour(BY_AVERAGE())hblockloading when--model noneand there is no duraci- error adding the same tab to a dashboard more the once
- error converting to csv when the binary has negative stages
- intermittent error loading an output on linux
system.load_level_lengthfloating point approximation
Submodules
- PSRClasses updated
- Highlight.js
11.6.0->11.7.0 - KaTeX
0.16.3->0.16.4
Changelog
0.19.0 (2022-12-15)
https://psrio.psr-inc.com/0.19.0/index.html
Added
- new s3 downloader
exp:select_scenarios(int, int)tab:set_disabled()tab:set_collapsed(boolean)study:has_hour_block_map()study:get_parameter(string, string)concatenate_blocks(...)info(std::vector<std::string>)ConcentratedSolarPowercollection (variables: hour_generation)ElectrificationDemandcollectionElectrificationDemandSegmentcollection (variables: hour, block, cost, hour_price)ElectrificationNetworkcollectionElectrificationNodecollectionElectrificationProcesscollectionElectrificationProducercollectionElectrificationStoragecollectionElectrificationTransportcollectionGasEmissioncollection (variables: code, cost)GasNodecollection (variables: code, production_cost_constraint)Loadcollection (variables: code, bus, hour_bus)ReservoirSetcollection (variables: code, security_energy, flood_control_energy, alert_energy)dclink.wheeling_cost_fromanddclink.wheeling_cost_tofuel.min_consumption,fuel.max_consumptionandfuel.availabilitysystem.carbon_credit_costthermal.startup_cost_constraint,thermal.spinning_reserve,thermal.max_reserve, andthermal.bid_pricebalancing_area.regulation_upandbalancing_area.regulation_downdemand.variable_block_durationdemand_segment.hour_priceanddemand_segment.block_price- error check in
exp:to_block()andexp:to_hour()when the case has no hour block map
Syntax Changes
study:is_hourly_load()tostudy:has_hourly_load()circuit.existingtocircuit.statedclink.existingtodclink.stategeneration_constraint.existingtogeneration_constraint.stategeneration_constraint.capacitytogeneration_constraint.datahydro.existingtohydro.staterenewable.existingtorenewable.statethermal.existingtothermal.state
Fixed
- docs publish (tag)
- errors in concatenate_stages and concatenate_scenarios when first_stage > 1
- add_index_translation
- active tab when the first ones are disabled
- error when creating the output path
Removed
thermal.forced_generationincludefolder (julia users should use the PSRIO.jl package)
Submodules
- AWS
1.9.379added - zlib
1.2.13added - AWS Integration updated
- Bootstrap
5.2.2->5.2.3 - Bootstrap Icons
1.9.1->1.10.2 - S3Integrations removed
Changelog
0.18.0 (2022-11-21)
https://psrio.psr-inc.com/0.18.0/index.html
Added
- new documentation (https://psrio.psr-inc.com/)
BY_ORDER(i)collection:inputs()study:stage_type(),study:blocks(stage), andstudy:initial_stage()--load_from_output_pathreading incollection:load_table(...)exp:moving(f, window)Profile.PER_QUARTERandProfile.QUARTERhydro.alert_storage_penaltyandhydro.alert_storage_penalty_typehydro.min_total_outflow_penaltyandhydro.min_total_outflow_penalty_typehydro.max_total_outflow_penaltyandhydro.max_total_outflow_penalty_typehydro.min_spillage_penaltyandhydro.min_spillage_penalty_typehydro.max_spillage_penaltyandhydro.max_spillage_penalty_typehydro.max_turbining_penaltyandhydro.max_turbining_penalty_typehydro.min_bio_spillage_penaltyandhydro.min_bio_spillage_penalty_typehydro.min_turbining_penaltyandhydro.min_turbining_penalty_typehydro.min_operative_storage_penaltyandhydro.min_operative_storage_penalty_typehydro.max_operative_storage_penaltyandhydro.max_operative_storage_penalty_type
Syntax Changes
study.blockstostudy.blocks_per_stagehydro.capacitytohydro.max_generationhydro.capacity_maintenancetohydro.max_generation_availablehydro.vmintohydro.min_storagehydro.vmaxtohydro.max_storagehydro.qmintohydro.min_turbining_outflowhydro.qmaxtohydro.max_turbining_outflowhydro.vmin_chronological_historical_scenarios_nodatatohydro.min_operative_storage_historical_scenarios_nodatahydro.vmin_chronological_historical_scenariostohydro.min_operative_storage_historical_scenarioshydro.vmin_chronologicaltohydro.min_operative_storagehydro.vmax_chronological_historical_scenarios_nodatatohydro.max_operative_storage_historical_scenarios_nodatahydro.vmax_chronological_historical_scenariostohydro.max_operative_storage_historical_scenarioshydro.vmax_chronologicaltohydro.max_operative_storage
Changed
- internal log structure
- internal compiler structure
Fixed
- temporary psrclasses files leftovers error
- relationship error
--model noneparameters checkexp:to_hour(f, "hblock file")andexp:to_block(f, "hblock file")error when the file does not exist
Submodules
- KaTeX
0.16.2->0.16.3
Changelog
0.17.0 (2022-10-19)
Added
exp:sort_agents_descending()andexp:sort_agents_ascending()exp:uncouple_stages(clear_first_stage)ExpansionConstraintandExpansionDecisioncollectionsbase/sddp/vere15.luahydro.max_turbining,hydro.spinning_reserve, andhydro.max_reservethermal.alternative_fuel$to favorite units- CI/CD: psr-update-modules
Syntax Changes
chart:add_heatmap(exp)tochart:add_heatmap_hourly(exp)generic:create(values, unit)togeneric:create(label, unit, values)exp:sort_agentstoexp:sort_agents_labelsdemand.maximum_increasetodemand.max_increasedemand.maximum_decreasetodemand.max_decreasedemand.maximum_curtailmenttodemand.max_curtailmenthydro.omcosttohydro.om_costhydro.FORtohydro.forced_outage_ratehydro.CORtohydro.historical_outage_factorexpansion_project.omcosttoexpansion_project.om_costrenewable.omcosttorenewable.om_costsystem.duracitosystem.load_level_lengthsystem.hblocktosystem.hour_block_mapthermal.omcosttothermal.om_costthermal.germintothermal.min_generationthermal.germin_maintenancetothermal.min_generation_availablethermal.capacitytothermal.max_generationthermal.capacity_maintenancetothermal.max_generation_availablethermal.FORtothermal.forced_outage_ratethermal.CORtothermal.historical_outage_factorthermal.cesp1tothermal.specific_consumption_segment_1thermal.cesp2tothermal.specific_consumption_segment_2thermal.cesp3tothermal.specific_consumption_segment_3thermal.transport_costtothermal.fuel_transportation_costthermal.must_runtothermal.operation_modethermal.minimum_uptimetothermal.min_uptimethermal.minimum_downtimetothermal.min_downtimethermal.maximum_startupstothermal.max_startupsthermal.maximum_shutdownstothermal.max_shutdowns
Fixed
- output selection
aggregate_stageswhen the first_stage > 1- missing columns when the series are added individually
- error when adding a chart more than once in the dashboard
Submodules
- Bootstrap
5.2.1->5.2.2
Changelog
0.16.0 (2022-09-21)
Added
Tabclass- dashboard submenu support
dashboard:set_icon(url)anddashboard:set_logo(url)exp:spread_blocks(blocks)exp:select_agents_by_regex(regex)andexp:remove_agents_by_regex(regex)
Fixed
- data literal when using a
--model none exp:to_block(f, "hblock file")exp:spread_stages()
Removed
Dashboardconcatenation operator (!)
Submodules
- Bootstrap
5.2.1 - GitHub Flavored Markdown
0.29.0.gfm.6
Changelog
0.15.0 (2022-09-02)
Added
- improved CI/CD
PSR.assert_version(version), ex:PSR.assert_version(=0.15.0),PSR.assert_version(>0.15.0)collection:codes()exp:fill(value)BY_KTH_LARGEST(p)andBY_KTH_LARGEST_INDEX(p)BY_KTH_SMALLEST(p)andBY_KTH_SMALLEST_INDEX(p)BY_MAX_INDEX()andBY_MIN_INDEX()exp:reshape_stages(Profile.MONTH)
Syntax Changes
BY_NTH_ELEMENT(p)toBY_PERCENTILE_INDEX(p)
Changed
BY_NPV(pu)toBY_NPV(percent), ex:BY_NPV(0.2)toBY_NPV(20)
Fixed
exp:select_agents({...})with duplicate agentsexp:reshape_stages(Profile.DAY)when exp has weekly stages
Submodules
- GitHub Flavored Markdown
0.29.0.gfm.5 - Highcharts
10.2.1 - KaTeX
0.16.2 - JSON
3.11.2
Changelog
0.14.3 (2022-08-19)
Added
- CI/CD: notify on slack
Fixed
- CI/CD: publish on master
- hourly scenarios data dimensions check
exp:aggregate_stages(f, profile)initial stage
0.14.0 (2022-08-17)
Added
- multi-language code syntax highlighting
- CI/CD via github actions
- require(...) access to .lua files next to the recipes
exp:circuit_from()andexp:circuit_to()to map buses to circuitsexp:dclink_from()andexp:dclink_to()to map buses to dclinks- relationship from buses to dclinks in
exp:aggregate_agents() exp:uncouple_blocks()exp:aggregate_slices(f, size)
Fixed
- units check in report
- data reading with "0/1" unit
Changelog
0.13.0 (2022-07-28)
Added
- subhourly support (1 min, 5 min, 10 min, 15 min, 20 min, 30 min)
TimeSeriesandRelationalclassesFlowControllercollectionchart:add_line_stacking(exp)#chartlengthstudy:initial_year()andstudy:final_year()collection.codeinput dataexp:to_list(stage, scenario, block)andexp:to_int_list(stage, scenario, block)exp:remove_scenarios({int, ...})exp:spread_stages()compare:set_relative_tolerance(double)andcompare:set_absolute_tolerance(double)
Syntax Changes
Compare(title, rtol = 1e-4, atol = 0)toCompare(title)
Changed
- lua
5.4.2to5.4.4 - sol
3.2.3to3.3.0 - feather-icons replaced by lucide.dev
collection:load_table(...)andcollection:load_table_without_header(...)from now on it considers all data as string- update to
0.29.0.gfm.4
Fixed
- utf8 encoding
- error in
concatenate_scenarios(...) - ternary operator when there were negative stages
Removed
- psrclasses epoch check
- study:save_relationship(...)
--return_errorsargument
Changelog
0.12.0 (2022-05-29)
Added
- raw HTML parsing in markdown
chart:add_categories(exp, label)andchart:add_categories(exp1, exp2, label)chart:add_line(exp, {color = {"#9b5de5", "#f15bb5", ...}})study:save_relationship("filename", from, to)Topology.TURBINED_FROMconcatenate_scenarios(exp1, exp2, ...)andclamp(exp, low, hi)exp:repeat_on_buffer_years()exp:to_hour(f, "hblock file")andexp:to_block(f, "hblock file")exp:force_blocks()exp:set_initial_stage(int)exp:select_agents(collection, {label1, label2, ...})exp:aggregate_stages(f, {stage1, stage2, ...})andexp:aggregate_scenarios_stages(f, {stage1, stage2, ...})exp:cumsum_agents()exp:fill_agents({int or string, int or string, ...}, value)collection:load_table_without_header("filename")psrclasses-netplan.datloading--load_from_output_pathargument
Syntax Changes
PSR.colors({"#ff0029", "#377eb8", ...})toPSR.set_global_colors({"#ff0029", "#377eb8", ...})
Changed
- improvements in dashboard frontend
- incremental progress bar in psrcloud
Fixed
- error in
exp:select_agents(query)when the attributes were different - error in
exp:select_agents(collection, {label})when there were multiple agents with the same label
Changelog
0.11.0 (2022-04-11)
Added
- dashboard frontend rework
- new unit match algorithm
- input data dimensions check rework
--label name,--label code, and--label avidarguments--ignore_hrbmapargumentexp:save(filename, {label="name"}),exp:save(filename, {label="code"}), andexp:save(filename, {label="avid"})exp:first_stage(),exp:last_stage(), andexp:code(index)Chart(title, subtitle)chart:add_spline(exp)chart:add_area_spline(exp),chart:add_area_spline_stacking(exp),chart:add_area_spline_percent(exp), andchart:add_area_spline_range(exp1, exp2)exp:remove_agent(index),exp:remove_agent(label), andexp:rename_agent(label)exp:select_agent_by_code(code)andexp:select_agents_by_code({code1, code2, ...})exp:remove_agent_by_code(code)andexp:remove_agents_by_code({code1, code2, ...})exp:rename_agents_with_codes()exp:select_agents(collection, label)exp:spread_scenarios(scenarios)collection:language()study:get_parameter(key, double)PSR.colors({"#ff0029", "#377eb8", ...})andPSR.interpolate_colors("#ff0000", "#00ff00", 4)toml:get_array_size(key)andtoml:get_array(key, i)sfd,R$units
Syntax Changes
exp:select_stages(stage)toexp:select_stage(stage)exp:select_stages(first_stage, -1)toexp:select_first_stage(first_stage)exp:select_stages(-1, last_stage)toexp:select_last_stage(last_stage)study:macro_agents(...)tocollection:load_tag(...)study:load_table(filename)tocollection:load_table(filename)study:load_toml(filename)tocollection:load_toml(filename)study:get_parameter(key)tostudy:get_parameter(key, int)Compare(title, rtol = 1e-4)toCompare(title, rtol = 1e-4, atol = 0)
Fixed
- fast_csv warning when the csv was locked
- saving in a directory that does not exist
Removed
--avidargumentchart:add_line_stacking(exp)andchart:add_line_percent(exp)
Changelog
0.10.1 (2022-02-14)
Fixed
- intermittent error in dependencies mode
0.10.0 (2022-02-07)
Added
- improved error messages
- linear domain axis chart (stage_type = 0)
chart:add_heatmap(exp)andchart:save(filename, title)dashboard:set_icon(string)based on feathericonscollection:cloudname()collection:get_directories(regex)andcollection:get_directories(subpath, regex)exp:select_agent(index)andexp:select_agent(label)exp:set_stage_type(int)exp:save(filename, {fast_csv = true})andexp:save(filename, {bin = true})exp:add_prefix(string)exp:rename_agent(string)exp:has_agent(label)exp:stages_to_agents()andexp:stages_to_agents(selected)PSR.sleep(seconds)PSR.version()info(table)- all aggregation functions in
exp:to_block(function)
Syntax Changes
study:load_table(filename)no longer assume the extension is a .csvexp:rename_agents_with_suffix(string)toexp:add_suffix(string)
Fixed
exp:select_scenarios({int, ...})when the first stage was different than 1- `chart:add_area_range(exp, exp) with data considering leap years
Removed
exp:save(filename, {tmp = true})
Changelog
0.9.0 (2022-01-03)
Added
- guards in the loading method to protect from psrclasses unknown error
report:add_header(string)generic:create({value1, value2, ...})andgeneric:create({value1, value2, ...}, "unit")study:load_table(filename)andcollection:get_files(regex)PSR.studies()- negative epoch
- relationship thermal/hydro/renewable plant to network areas
CO,tCOunits
Syntax Changes
add_index_translationtoPSR.add_index_translation
Changed
- improvements in security
- improvements in report classes
- improvements in units classes
- improvements in makefile and psrcloud deploy
- argument
--recipescan be a directory, and the psrio will search for all *.lua files
Fixed
- CVAR aggregation when the values were equal
- error in dependencies mode when saving a not selected output
- error loading an output with upper case filename in linux
- memory constraint on loading large hourly scenarios
- error in BY_SUM(), BY_MIN(), and BY_MAX() when there were no values to aggregate
- rollback to lua 5.4.2 (https://github.com/ThePhD/sol2/issues/1266)
Changelog
0.8.0 (2021-11-18)
Added
- LaTeX math support in markdown (
$$ ... $$) exp:select_agents(std::vector<std::string>)exp:replace(exp)int = study:get_parameter(string)exp:select_largest_agents(k)andexp:select_smallest_agents(k)study:openings()exp:sort_agents()Compare(title, epsilon = 1e-4)100max errors in Comparesddpconfig.datreadingexp:force_collection(collection)- parm reference relationship
--return_errorsargument
Syntax Changes
study.stagestostudy:stages()study.stages_per_yeartostudy:stages_per_year()study.scenariostostudy:scenarios()study:parent_path()tostudy:dirname()collection:load(filename, true)tocollection:load_or_error(filename)
Changed
- performance improvement in
concatenate(exp1, exp2, ...) - performance improvement in
exp:select_agents(query)
Fixed
- stderr when the case does not exists
- unit in power binary expression (^)
- study.discount_rate unit
- error using remove_zeros and horizon
Changelog
0.7.0 (2021-09-24)
Added
- new dashboard structure with markdown support
- multiple cases support
- output comparison with report files
- lua helpers, e.g. require("lua/spairs")
exp:rename_agents_with_suffix(string)exp:select_block(block)collection:load(filename, true)to raise error if the file is not foundexp:force_unit(unit)exp = exp:save_cache()exp:aggregate_scenarios_stages(f)exp:remove_zeros()exp:aggregate_agents(f, group_size)exp:uncouple_stages()study:path()andstudy:parent_path()exp:set_initial_year(year)do_string(code)(meta programming)shift_stages(stages)- topology enumerate and
exp:aggregate_topology(f, topology) info(msg),warning(msg),error(msg)- forward and backward reading
Changed
exp:agents()return a vector of lua objects- unit conversion in logical binary expressions
Fixed
exp:aggregate_stages()in monthly-hourly cases- missing blocks in binary expression
- eps in logical binary operations (lq, le, gt, ge)
exp:to_hour()andexp:to_block()when the input has no blocks- stderr not showing in the log in release mode
- optgen study loading
Changelog
0.6.0 (2021-06-04)
Added
- interactive mode (REPL)
- psrio-base and
require("<base>") include("<file>")with relative directory- runtime input data loading:
collection:load_vector(attribute, unit)andcollection:load_parameter(attribute, unit) exp:select_stages(stage),exp:select_stages_by_year(initial_year, final_year),exp:reset_stages()exp:select_scenarios(scenario)andexp:select_scenarios({scenario})[per stage]exp:select_agents(query)exp:round(digits)exp:force_hourly()exp:save("<file>", { horizon = true })- attributes getters:
exp:loaded(),exp:unit(),exp:agents(),exp:agents_size(),exp:agent(int i),exp:scenarios()exp:stage_type(),exp:initial_year(),exp:initial_stage(),exp:stages(),exp:week(stage),exp:month(stage),exp:year(stage)exp:blocks(int),exp:has_blocks(),exp:is_hourly(),exp:to_list(),exp:to_int_list()
study:is_hourly()andstudy:is_genesys()methodspuunitadd_index_translation(...)andmacro_agents()functions- single binary support
- relationship from buses to circuits in
exp:aggregate_agents()
Changed
- added files in indice.grf even if it is not in indexdat.fmt
- deleted bin/hdr files in CSV mode
Fixed
- several fixes of methods with first_stage > 1
- error handling when loading an output with the wrong collection
- error in concatenate when expression agents = 0
- input hourly data loading when there is no hour-block mapping file
exp:to_block()and historical scenarios performance
Removed
- variable_by_scenario metadata (variable_by_scenario = false is now scenarios = 1)
--skipargument, now it is automatic
Changelog
0.5.0 (2021-01-27)
Added
- psrio + lua
- dashboard support
--horizon <date>to change to initial date--model noneto load an empty study
Changed
- procedural to functional syntax
Removed
- bison scanner and parser
- verbose 1f, 2f, and 3f (use 1, 2, or 3)
Changelog
0.4.1 (2021-01-12)
Added
- first and last stage attributes to all variables and operators
select_stages(exp, first_stage, last_stage)rename_agents(exp, [string, string, ...])- argument
--logname <string>to rename the log files (psrio.logandpsrio-psrclasses.logto<string>.logand<string>-psrclasses.log)
Changed
crop_stages(exp)is nowselect_stages(exp)
Fixed
indexdat.fmtconcurrent access
0.4.0 (2020-12-01)
Changed
- agents selection by order or name:
select_agents(exp, {int or string, int or string, ...}) - scenarios selection parameter in aggregation:
aggregate_scenarios(type, exp, {int, int, ...})
Removed
- argument
--append
Attributes
Attributes are properties that characterize an expression or a study. For example, expressions related to the results of a PSR model, whose data can change over stages, scenarios, and blocks, have a set of attributes in PSRIO that can be useful in some tasks. In the example below, we load the thermal generation:
thermal = Thermal();
gerter = thermal:load("gerter");
And the log shows some expression's attributes information:
[info] Loading gerter (stages: 12 [1:12] [month] [10/2016], blocks: hour, scenarios: 1200, unit: GWh, agents: 3 [thermal])
From the log, it is possible to see that gerter has:
- 12 stages in a month-level resolution, where the first stage is 1 and the last is 12
- Initial stage is 10 (october) and the initial year is 2016
- Hourly discretization
- 1200 scenarios
- Generation data given in GWh
- 3 agents (thermal plants)
Expression Attributes
All attributes related to stages, block, scenarios, agents and units of an expression and their respective methods are presented in the tables below.
Stages
| Method | Return Type |
|---|---|
exp:first_stage() |
number |
exp:last_stage() |
number |
exp:stage_type() |
number |
exp:initial_stage() |
number |
exp:initial_year() |
number |
exp:final_year() |
number |
exp:week(stage) |
number |
exp:month(stage) |
number |
exp:year(stage) |
number |
exp:stage(index) |
number |
exp:stages() |
number |
Example
stages = gerter:stages() -- 12

stage1 = gerter:stage(1) -- 10
stage2 = gerter:stage(2) -- 11
stage3 = gerter:stage(3) -- 12
stage4 = gerter:stage(4) -- 13

stage_type = gerter:stage_type() -- 2 (monthly)

initial_stage = gerter:initial_stage() -- 10
initial_year = gerter:initial_year() -- 2016
final_year = gerter:final_year() -- 2017

month1 = gerter:month(1) -- 10
month2 = gerter:month(2) -- 11
month3 = gerter:month(3) -- 12
month4 = gerter:month(4) --  1

year1 = gerter:year(1) -- 2016
year4 = gerter:year(4) -- 2017
Blocks
| Method | Return Type |
|---|---|
exp:blocks(stage) |
number |
exp:has_blocks() |
boolean |
exp:is_hourly() |
boolean |
exp:hour_discretization() |
number |
Example
blocks1 = gerter:blocks(1) -- 744
blocks2 = gerter:blocks(2) -- 720

has_blocks = gerter:has_blocks() -- true

is_hourly = gerter:is_hourly() -- true
Scenarios
| Method | Return Type |
|---|---|
exp:scenarios() |
number |
Example
scenarios = gerter:scenarios() -- 1200
Agents
| Method | Return Type |
|---|---|
exp:agents_size() |
number |
exp:agent(index) |
string |
exp:code(index) |
number |
exp:agents() |
table of strings |
exp:codes() |
table of numbers |
exp:has_agent(string) |
boolean |
Example
agents = gerter:agents() -- { "Thermal 1", "Thermal 2", "Thermal 3" }
for i, agent in ipairs(agents) do
    info(agent .. " at index " .. i);
end
size = gerter:agents_size() -- 3
for i = 1,size do
    agent = gerter:agent(i);
    info(agent .. " at index " .. i);
end
[info] Thermal 1 at index 1
[info] Thermal 2 at index 2
[info] Thermal 3 at index 3
Unit
| Method | Return Type |
|---|---|
exp:unit() |
string |
Example
unit = gerter:unit() -- "GWh"
Study Attributes
Stages
| Method | Return Type |
|---|---|
study:stage_type() |
number |
study:initial_stage() |
number |
study:initial_year() |
number |
study:final_year() |
number |
study:stages() |
number |
study:stages_per_year() |
number |
Blocks
| Method | Return Type |
|---|---|
study:blocks(stage) |
number |
study:is_hourly() |
boolean |
study:has_hourly_load() |
boolean |
study:has_hour_block_map() |
boolean |
Scenarios
| Method | Return Type |
|---|---|
study:scenarios() |
number |
study:openings() |
number |
Others
| Method | Return Type |
|---|---|
study:get_parameter(key, fallback_integer) |
integer |
study:get_parameter(key, fallback_double) |
double |
Collection Syntax
| Collection | Constructor | Enumerate |
|---|---|---|
| Area | Area() |
Collection.AREA |
| Balancing Area | BalancingArea() |
Collection.BALANCING_AREA |
| Balancing Area Hydro | BalancingAreaHydro() |
Collection.BALANCING_AREA_HYDRO |
| Balancing Area Thermal | BalancingAreaThermal() |
Collection.BALANCING_AREA_THERMAL |
| Battery | Battery() |
Collection.BATTERY |
| Bus | Bus() |
Collection.BUS |
| Circuit | Circuit() |
Collection.CIRCUIT |
| Circuits Sum | CircuitsSum() |
Collection.CIRCUITS_SUM |
| Concentrated Solar Power | ConcentratedSolarPower() |
Collection.CONCENTRATED_SOLAR_POWER |
| DC Link | DCLink() |
Collection.DC_LINK |
| Demand | Demand() |
Collection.DEMAND |
| Demand Segment | DemandSegment() |
Collection.DEMAND_SEGMENT |
| Expansion Capacity | ExpansionCapacity() |
Collection.EXPANSION_CAPACITY |
| Expansion Project | ExpansionProject() |
Collection.EXPANSION_PROJECT |
| Fuel | Fuel() |
Collection.FUEL |
| Fuel Consumption | FuelConsumption() |
Collection.FUEL_CONSUMPTION |
| Fuel Contract | FuelContract() |
Collection.FUEL_CONTRACT |
| Fuel Reservoir | FuelReservoir() |
Collection.FUEL_RESERVOIR |
| Generator | Generator() |
Collection.GENERATOR |
| Generation Constraint | GenerationConstraint() |
Collection.GENERATION_CONSTRAINT |
| Generic | Generic() |
--- |
| Hydro | Hydro() |
Collection.HYDRO |
| Hydro Gauging Station | HydroGaugingStation() |
Collection.HYDRO_GAUGING_STATION |
| Interconnection | Interconnection() |
Collection.INTERCONNECTION |
| Interconnection Sum | InterconnectionSum() |
Collection.INTERCONNECTION_SUM |
| Power Injection | PowerInjection() |
Collection.POWER_INJECTION |
| Renewable | Renewable() |
Collection.RENEWABLE |
| Renewable Gauging Station | RenewableGaugingStation() |
Collection.RENEWABLE_GAUGING_STATION |
| Reserve Generation Constraint | ReserveGenerationConstraint() |
Collection.RESERVE_GENERATION_CONSTRAINT |
| Reservoir Set | ReservoirSet() |
Collection.RESERVOIR_SET |
| Study | Study() |
--- |
| System | System() |
Collection.SYSTEM |
| Thermal | Thermal() |
Collection.THERMAL |
Loading an Output
| Operator | Syntax |
|---|---|
| Load method | output = collection:load("filename") |
The generic collection can load any output with any agent type.
Example
The following example loads two outputs, gerhid and fprodt, considering the agents as hydro plants collection:
hydro = Hydro();
gerhid = hydro:load("gerhid");
fprodt = hydro:load("fprodt");
Example
The following example loads two outputs, cmgdem and demand, considering the agents as system collection:
system = System();
cmgdem = system:load("cmgdem");
demand = system:load("demand");
Example 3
The following example loads two outputs, gerter and coster, considering the agents as thermal plants collection:
thermal = Thermal();
gerter = thermal:load("gerter");
coster = thermal:load("coster");
Example 4
The following example loads two outputs, objcop and outdfact, considering the agents as generic:
generic = Generic();
objcop = generic:load("objcop");
outdfact = generic:load("outdfact");
Loading a Generic CSV
| Operator | Syntax |
|---|---|
| Load table method | table = study:load_table("filename.csv") |
The following example loads a generic csv table and iterates through the rows:
Example
file.csv:
Name         , Node, Interval, Startup, Participation
H_1_1        , 1   , 1       , 1      , 0.79
R_1_3        , 1   , 1       , 1      , 0.20
CONTRATO_FLAT, 1   , 1       , 1      , 1
script:
study = Study();
table = study:load_table("file.csv");

info("Name,Node,Interval,Startup,Participation");
for i=1,#table do
    info(
        table[i]["Name"] .. "," ..
        table[i]["Node"] .. "," ..
        table[i]["Interval"] .. "," ..
        table[i]["Startup"] .. "," ..
        table[i]["Participation"]
    );
end
Loading an Input
- Area
- Battery
- Bus
- Circuit
- Concentrated Solar Power
- DC Link
- Demand
- Demand Segment
- Fuel
- Gauging Station
- Hydro
- Hydro
- Interconnection
- Power Injection
- Renewable
- Renewable Gauging Station
- Reservoir Set
- System
- Thermal
Area
| Data | Unit |
|---|---|
area.code |
--- |
area.import_limit |
MW |
area.export_limit |
MW |
Battery
| Data | Unit |
|---|---|
battery.code |
--- |
battery.state |
--- |
battery.capacity |
MW |
Bus
| Data | Unit |
|---|---|
bus.code |
--- |
bus.voltage_level |
kV |
Circuit
| Data | Unit |
|---|---|
circuit.code |
--- |
circuit.state |
--- |
circuit.resistance |
% |
circuit.reactance |
% |
circuit.capacity |
MW |
circuit.emergency_capacity |
MW |
circuit.DLR_factor |
pu |
circuit.monitored |
--- |
circuit.monitored_contingencies |
--- |
circuit.is_dc |
--- |
circuit.international_cost_from |
$/MWh |
circuit.international_cost_to |
$/MWh |
Concentrated Solar Power
| Data | Unit |
|---|---|
concentrated_solar_power.hour_scenarios |
pu |
DC Link
| Data | Unit |
|---|---|
dclink.code |
--- |
dclink.state |
--- |
dclink.capacity_from |
MW |
dclink.capacity_to |
MW |
dclink.wheeling_cost_from |
$/MWh |
dclink.wheeling_cost_to |
$/MWh |
Demand
| Data | Unit |
|---|---|
demand.code |
--- |
demand.is_elastic |
--- |
demand.inelastic_hour |
MW |
demand.inelastic_block |
GWh |
demand.is_flexible |
--- |
demand.max_increase |
pu |
demand.max_decrease |
pu |
demand.curtailment_cost |
$/MWh |
demand.max_curtailment |
pu |
demand.variable_block_duration |
h |
Demand Segment
| Data | Unit |
|---|---|
demand_segment.hour |
MW |
demand_segment.block |
GWh |
demand_segment.hour_price |
$/MWh |
demand_segment.block_price |
$/MWh |
Fuel
| Data | Unit |
|---|---|
fuel.code |
--- |
fuel.cost |
$/gal |
fuel.emission_factor |
tCO2/MWh |
fuel.min_consumption |
kgal |
fuel.max_consumption |
kgal |
fuel.availability |
kgal |
Gauging Station
| Data | Unit |
|---|---|
gauging_station.code |
--- |
gauging_station.inflow |
m3/s |
gauging_station.forward |
m3/s |
gauging_station.backward |
m3/s |
gauging_station.hour_inflow_historical_scenarios_nodata |
--- |
gauging_station.hour_inflow_historical_scenarios |
m3/s |
gauging_station.hour_inflow |
m3/s |
Hydro
| Data | Unit |
|---|---|
hydro.code |
--- |
hydro.state |
--- |
hydro.units |
--- |
hydro.system |
--- |
hydro.max_generation |
MW |
hydro.max_generation_available |
MW |
hydro.forced_outage_rate |
% |
hydro.historical_outage_factor |
% |
hydro.min_storage |
hm3 |
hydro.max_storage |
hm3 |
hydro.min_turbining_outflow |
m3/s |
hydro.max_turbining_outflow |
m3/s |
hydro.om_cost |
$/MWh |
hydro.irrigation |
m3/s |
hydro.min_total_outflow_modification |
m3/s |
hydro.target_storage_tolerance |
% |
hydro.disconsider_in_stored_and_inflow_energy |
--- |
hydro.mean_production_coefficient |
MW/(m3/s) |
hydro.loss_factor |
pu |
hydro.min_total_outflow |
m3/s |
hydro.min_total_outflow_unit_violation_cost |
k$/m3/s |
hydro.min_total_outflow_violation_type |
--- |
hydro.max_total_outflow |
m3/s |
hydro.max_total_outflow_unit_violation_cost |
k$/m3/s |
hydro.max_total_outflow_violation_type |
--- |
hydro.min_operative_storage |
hm3 |
hydro.min_operative_storage_unit_violation_cost |
k$/hm3 |
hydro.min_operative_storage_violation_type |
--- |
hydro.max_operative_storage |
hm3 |
hydro.max_operative_storage_unit_violation_cost |
k$/hm3 |
hydro.max_operative_storage_violation_type |
--- |
hydro.flood_control |
hm3 |
hydro.alert_storage |
hm3 |
hydro.alert_storage_unit_violation_cost |
k$/hm3 |
hydro.alert_storage_violation_type |
--- |
hydro.min_spillage |
m3/s |
hydro.min_spillage_unit_violation_cost |
k$/m3/s |
hydro.min_spillage_violation_type |
--- |
hydro.max_spillage |
m3/s |
hydro.max_spillage_unit_violation_cost |
k$/m3/s |
hydro.max_spillage_violation_type |
--- |
hydro.min_bio_spillage |
% |
hydro.min_bio_spillage_unit_violation_cost |
k$/hm3 |
hydro.min_bio_spillage_violation_type |
--- |
hydro.target_storage |
hm3 |
hydro.max_turbining |
m3/s |
hydro.max_turbining_unit_violation_cost |
k$/m3/s |
hydro.max_turbining_violation_type |
--- |
hydro.min_turbining_unit_violation_cost |
k$/m3/s |
hydro.min_turbining_violation_type |
--- |
hydro.spinning_reserve |
% |
hydro.max_reserve |
MW |
Hydro (tables)
| Data | Unit |
|---|---|
hydro.storage_x_elevation__storage_1 |
hm3 |
hydro.storage_x_elevation__storage_2 |
hm3 |
hydro.storage_x_elevation__storage_3 |
hm3 |
hydro.storage_x_elevation__storage_4 |
hm3 |
hydro.storage_x_elevation__storage_5 |
hm3 |
hydro.storage_x_elevation__elevation_1 |
masl |
hydro.storage_x_elevation__elevation_2 |
masl |
hydro.storage_x_elevation__elevation_3 |
masl |
hydro.storage_x_elevation__elevation_4 |
masl |
hydro.storage_x_elevation__elevation_5 |
masl |
Interconnection
| Data | Unit |
|---|---|
interconnection.code |
--- |
interconnection.state |
--- |
interconnection.capacity_from |
MW |
interconnection.capacity_to |
MW |
interconnection.cost_from |
$/MWh |
interconnection.cost_to |
$/MWh |
Power Injection
| Data | Unit |
|---|---|
power_injection.code |
--- |
power_injection.hour_capacity |
MW |
power_injection.hour_price |
$/MWh |
Renewable
| Data | Unit |
|---|---|
renewable.code |
--- |
renewable.state |
--- |
renewable.units |
--- |
renewable.tech_type |
--- |
renewable.capacity |
MW |
renewable.om_cost |
$/MWh |
renewable.hour_scenarios |
pu |
renewable.block_scenarios |
pu |
renewable.operation_factor |
pu |
Renewable Gauging Station
| Data | Unit |
|---|---|
renewable_gauging_station.code |
--- |
renewable_gauging_station.hour_scenarios |
pu |
renewable_gauging_station.block_scenarios |
pu |
renewable_gauging_station.hour_historical_scenarios |
pu |
Reservoir Set
| Data | Unit |
|---|---|
reservoir_set.code |
--- |
reservoir_set.security_energy |
MWh |
reservoir_set.flood_control_energy |
MWh |
reservoir_set.alert_energy |
MWh |
System
System
| Data | Unit |
|---|---|
system.code |
--- |
system.load_level_length |
--- |
system.hour_block_map |
--- |
system.sensitivity |
--- |
system.carbon_credit_cost |
$/tCO2 |
Thermal
| Data | Unit |
|---|---|
thermal.code |
--- |
thermal.state |
--- |
thermal.units |
--- |
thermal.system |
--- |
thermal.min_generation |
MW |
thermal.min_generation_available |
MW |
thermal.min_generation_constraint |
MW |
thermal.max_generation |
MW |
thermal.max_generation_available |
MW |
thermal.forced_outage_rate |
% |
thermal.historical_outage_factor |
% |
thermal.startup_cost |
k$ |
thermal.startup_cost_constraint |
k$ |
thermal.om_cost |
$/MWh |
thermal.specific_consumption_segment_1 |
gal/MWh |
thermal.specific_consumption_segment_2 |
gal/MWh |
thermal.specific_consumption_segment_3 |
gal/MWh |
thermal.fuel_transportation_cost |
$/gal |
thermal.operation_mode |
--- |
thermal.emission_coefficient |
pu |
thermal.ramp_up |
MW/min |
thermal.ramp_down |
MW/min |
thermal.min_uptime |
hour |
thermal.min_downtime |
hour |
thermal.max_startups |
--- |
thermal.max_shutdowns |
--- |
thermal.shutdown_cost |
k$ |
thermal.alternative_fuel |
--- |
thermal.spinning_reserve |
% |
thermal.max_reserve |
MW |
thermal.bid_price |
$/MWh |
Unary Expressions
Minus
$$ \operatorname{exp}=-\operatorname{exp1} $$
Absolute Value
$$ \operatorname{exp}=\operatorname{exp1:abs}() $$
Example
circuit = Circuit();
cirflw = circuit:load("cirflw");
abs_cirflw = cirflw:abs();
Round
$$ \operatorname{exp}=\operatorname{exp1:round}(\operatorname{int}) $$
Fill
$$ \operatorname{exp}=\operatorname{exp1:fill}(\operatorname{double}) $$
Unit Conversion
$$ \operatorname{exp}=\operatorname{exp1:convert}(\operatorname{string}) $$
Example
thermal = Thermal();
gerter = circuit:load("gerter");
gerterMW = gerter:convert("MW");
Binary Expressions
Addition
$$ \operatorname{exp}=\operatorname{exp1}+\operatorname{exp2} $$
Example
hydro = Hydro();
spilled_outflow = hydro:load("qverti");
turbined_outflow = hydro:load("qturbi");
total_outflow = spilled_outflow + turbined_outflow;
Subtraction
$$ \operatorname{exp}=\operatorname{exp1}-\operatorname{exp2} $$
Example
hydro = Hydro();
useful_storage = hydro.max_storage - hydro.min_storage;
Multiplication
$$ \operatorname{exp}=\operatorname{exp1}*\operatorname{exp2} $$
Example
renewable = Renewable();
renewable_generation = renewable:load("gergnd");
renewable_om_cost = renewable_generation * renewable.om_cost;
Right Division
$$ \operatorname{exp}=\operatorname{exp1}/\operatorname{exp2} $$
Example
circuit = Circuit();
circuit_flow = circuit:load("cirflw");
circuit_loading = circuit_flow / circuit.capacity;
Power
$$ \operatorname{exp}=\operatorname{exp1}\char`^\operatorname{exp2} $$
Equal to
$$ \operatorname{exp}=\operatorname{exp1:eq}(\operatorname{exp2}) $$
Not Equal to
$$ \operatorname{exp}=\operatorname{exp1:ne}(\operatorname{exp2}) $$
Less-than
$$ \operatorname{exp}=\operatorname{exp1:lt}(\operatorname{exp2}) $$
Less-than-or-equals to
$$ \operatorname{exp}=\operatorname{exp1:le}(\operatorname{exp2}) $$
Greater-than
$$ \operatorname{exp}=\operatorname{exp1:gt}(\operatorname{exp2}) $$
Greater-than-or-equals to
$$ \operatorname{exp}=\operatorname{exp1:ge}(\operatorname{exp2}) $$
And
$$ \operatorname{exp}=\operatorname{exp1}\&\operatorname{exp2} $$
Or
$$ \operatorname{exp}=\operatorname{exp1}|\operatorname{exp2} $$
Maximum
$$ \operatorname{exp}=\operatorname{max}(\operatorname{exp1}, \operatorname{exp2}) $$
Example
hydro = Hydro();
turbined_outflow = hydro:load("qturbi");
minimum_turbined_outflow = max(hydro.min_turbining_outflow - turbined_outflow, 0);
Minimum
$$ \operatorname{exp}=\operatorname{min}(\operatorname{exp1}, \operatorname{exp2}) $$
Example
hydro = Hydro();
production_factor = hydro:load("fprodt");
available_hydro_capacity = min(hydro.max_turbining_outflow * production_factor, hydro.max_generation_available);
Ternary Expressions
Conditional
$$ \operatorname{exp}=\operatorname{ifelse}(\operatorname{exp1}, \operatorname{exp2}, \operatorname{exp3}) $$
Example
thermal = Thermal();
gerter = thermal:load("gerter");
gerter_gt_zero = ifelse(gerter:gt(0.0), 1, 0);
Aggregate Functions
| Syntax |
|---|
BY_SUM() |
BY_MULTIPLICATION() |
BY_AVERAGE() |
BY_CVAR_L(number) |
BY_CVAR_R(number) |
BY_STDDEV() |
BY_REPEATING() |
BY_FIRST_VALUE() |
BY_ORDER(number) |
BY_LAST_VALUE() |
BY_MAX() |
BY_MAX_INDEX() |
BY_MIN() |
BY_MIN_INDEX() |
BY_KTH_LARGEST(number) |
BY_KTH_LARGEST_INDEX(number) |
BY_KTH_SMALLEST(number) |
BY_KTH_SMALLEST_INDEX(number) |
BY_PERCENTILE(number) |
BY_PERCENTILE_INDEX(number) |
Scenarios
Aggregate Scenarios
$$ \operatorname{exp}=\operatorname{exp1:aggregate\_scenarios}(\operatorname{f}) $$
Example
system = System();
cmgdem = system:load("cmgdem");
cmgdem_avg = cmgdem:aggregate_scenarios(BY_AVERAGE());
cmgdem_p90 = cmgdem:aggregate_scenarios(BY_PERCENTILE(90));
Aggregate Selected Scenarios
$$ \operatorname{exp}=\operatorname{exp1:aggregate\_scenarios}(\operatorname{f}, \{\operatorname{int}, \operatorname{int}, ...\}) $$
Example
system = System();
cmgdem = system:load("cmgdem");
cmgdem_max = cmgdem:aggregate_scenarios(BY_MAX(), {1, 2, 3, 4, 5});
Select One Scenario
$$ \operatorname{exp}=\operatorname{exp1:select\_scenario}(\operatorname{int}) $$
Example
system = System();
cmgdem = system:load("cmgdem");
cmgdem_scenario32 = cmgdem:select_scenario(32);
Select Multiple Scenarios
$$ \operatorname{exp}=\operatorname{exp1:select\_scenarios}(\{\operatorname{int}, \operatorname{int}, ...\}) $$
Select Scenarios Range
$$ \operatorname{exp}=\operatorname{exp1:select\_scenarios}(\operatorname{int}, \operatorname{int}) $$
Remove Multiple Scenarios
$$ \operatorname{exp}=\operatorname{exp1:remove\_scenarios}(\{\operatorname{int}, \operatorname{int}, ...\}) $$
Blocks/Hours
Aggregate Blocks/Hours
$$ \operatorname{exp}=\operatorname{exp1:aggregate\_blocks}(\operatorname{f}) $$
Example
system = System();
cmgdem = system:load("cmgdem");
cmgdem_agg = cmgdem:aggregate_blocks(BY_AVERAGE());

renewable = Renewable();
gergnd = renewable:load("gergnd");
gergnd_agg = gergnd:aggregate_blocks(BY_SUM());
Select One Block/Hour
$$ \operatorname{exp}=\operatorname{exp1:select\_block}(\operatorname{int}) $$
Example
system = System();
cmgdem = system:load("cmgdem");
cmgdem_block21 = cmgdem:select_block(21);
Map Blocks into Hours
$$ \operatorname{exp}=\operatorname{exp1:to\_hour}(\operatorname{f}) $$
Where f is BY_AVERAGE() or BY_REPEATING().
Example
system = System();
cmgdem_block = system:load("cmgdem");
cmgdem_hourly = cmgdem_block:to_hour(BY_REPEATING());
Map Hours into Blocks
$$ \operatorname{exp}=\operatorname{exp1:to\_block}(\operatorname{f}) $$
Where f is BY_AVERAGE() or BY_SUM().
Example
thermal = Thermal();
gerter_hourly = thermal:load("gerter");
gerter_block = gerter_hourly:to_block(BY_SUM());
Stages
Aggregate Stages
$$ \operatorname{exp}=\operatorname{exp1:aggregate\_stages}(\operatorname{f}) $$
Aggregate Stages into a Profile
$$ \operatorname{exp}=\operatorname{exp1:aggregate\_stages}(\operatorname{f}, \operatorname{profile}) $$
Where profile is the following enumerate:
| Profiles |
|---|
Profile.STAGE |
Profile.WEEK |
Profile.MONTH |
Profile.QUARTER |
Profile.YEAR |
Profile.PER_WEEK |
Profile.PER_MONTH |
Profile.PER_QUARTER |
Profile.PER_YEAR |
Profile.STAGE
The Profile.STAGE is the default value to characterize the aggregation if the user does not inform any profile. The data associated with each stage of the study horizon is aggregated.
| exp1 | exp (Profile.STAGE) |
|---|---|
n (daily) |
1 (daily) |
n (weekly) |
1 (weekly) |
n (monthly) |
1 (monthly) |
n (yearly) |
1 (yearly) |
Profile.WEEK and Profile.PER_WEEK
When the data has a daily resolution and the aggregation profile is Profile.WEEK, PSRIO will aggregate the data for each day of the weeks in the study period, i.e., that data regarding all Mondays in the data set will be aggregated into one value and the same for Tuesday, Wednesday, and so on. With a daily resolution and the aggregation Profile.PER_WEEK, PSRIO will aggregate the data related to each week of the study.
When the data is weekly and we request is Profile.WEEK, the data associated with each week is aggregated in one week. If the request is the aggregation Profile.PER_WEEK, PSRIO will do nothing and the data will remains the same.
These aggregation profiles are not defined for monthly and yearly resolution data.
| exp1 | exp (Profile.WEEK) |
exp (Profile.PER_WEEK) |
|---|---|---|
n (daily) |
7 (daily) |
n/7 (weekly) |
n (weekly) |
1 (weekly) |
n (weekly) |
n (monthly) |
❌ | ❌ |
n (yearly) |
❌ | ❌ |
Example
system = System();
cmgdem = system:load("cmgdem");
cmgdem_agg = cmgdem:aggregate_blocks(BY_AVERAGE(), Profile.WEEK);
Example
system = System();
cmgdem = system:load("cmgdem");
cmgdem_agg = cmgdem:aggregate_blocks(BY_AVERAGE(), Profile.PER_WEEK);
Profile.MONTH and Profile.PER_MONTH
Similar to Profile.WEEK and Profile.PER_WEEK, when the data has daily discretization and we request Profile.MONTH, PSRIO will aggregate the data for each day of the months in the study period. For example, PSRIO will aggregate all 1st days of each month and the same for the others months. If we request the Profile.PER_MONTH, PSRIO will aggregate the data related to each month.
When the data has month-level discretization and we request Profile.MONTH, PSRIO will aggregate the data associated with each month. If we request Profile.PER_MONTH, nothing is done to the data.
These aggregation profiles are not defined for weekly and yearly resolution data.
| exp1 | exp (Profile.MONTH) |
exp (Profile.PER_MONTH) |
|---|---|---|
n (daily) |
31 (daily) |
n/~30 (monthly) |
n (weekly) |
❌ | ❌ |
n (monthly) |
1 (monthly) |
n (monthly) |
n (yearly) |
❌ | ❌ |
Example
system = System();
cmgdem = system:load("cmgdem");
cmgdem_agg = cmgdem:aggregate_blocks(BY_AVERAGE(), Profile.MONTH);
Example
system = System();
cmgdem = system:load("cmgdem");
cmgdem_agg = cmgdem:aggregate_blocks(BY_AVERAGE(), Profile.PER_MONTH);
Profile.YEAR and Profile.PER_YEAR
When the data has a daily resolution and we request a Profile.YEAR, the data related to each day of years is aggregated. For example, PSRIO will aggregate all January 1st days in the study period, which is done for the other days of the year. If we request a Profile.PER_YEAR, the data associated with each year is aggregated. The same happens when the data has week, month, or year-level resolution if Profile.PER_YEAR is selected.
If the data has a year resolution and profile.YEAR is selected. the data related to the same year is aggregated.
The profile.YEAR profile is not defined for weekly and monthly resolution data.
| exp1 | exp (Profile.YEAR) |
exp (Profile.PER_YEAR) |
|---|---|---|
n (daily) |
365 (daily) |
n/365 (yearly) |
n (weekly) |
52 (weekly) |
n/52 (yearly) |
n (monthly) |
12 (monthly) |
n/12 (yearly) |
n (yearly) |
1 (yearly) |
1 (yearly) |
Example
system = System();
defcit = system:load("defcit");
defcit_per_year = defcit:aggregate_stages(BY_SUM(), Profile.YEAR);
Example
system = System()
defcit = system:load("defcit")
defcit_per_year = defcit:aggregate_stages(BY_SUM(), Profile.PER_YEAR);
Select One Stage
$$ \operatorname{exp}=\operatorname{exp1:select\_stage}(\operatorname{int}) $$
generic = Generic();
objcop = generic:load("objcop");
objcop_1st_stage = objcop:select_stage(1);
Select the First Stage
$$ \operatorname{exp}=\operatorname{exp1:select\_first\_stage}(\operatorname{int}) $$
generic = Generic();
objcop = generic:load("objcop");
objcop_2nd_to_n_stage = objcop:select_first_stage(2);
Select the Last Stage
$$ \operatorname{exp}=\operatorname{exp1:select\_last\_stage}(\operatorname{int}) $$
generic = Generic();
objcop = generic:load("objcop");
objcop_1st_to_2nd_stage = objcop:select_last_stage(2);
Select the First and the Last Stages
$$ \operatorname{exp}=\operatorname{exp1:select\_stages}(\operatorname{int}, \operatorname{int}) $$
generic = Generic();
objcop = generic:load("objcop");
objcop_2nd_to_4th_stage = objcop:select_stages(2, 4);
Select Stages by a First and a Last Years
$$ \operatorname{exp}=\operatorname{exp1:select\_stages\_by\_year}(\operatorname{int}, \operatorname{int}) $$
generic = Generic();
objcop = generic:load("objcop");
objcop_2030_2040 = objcop:select_stages_by_year(2030, 2040);
Select Stages by a Year
$$ \operatorname{exp}=\operatorname{exp1:select\_stages\_by\_year}(\operatorname{int}) $$
generic = Generic();
objcop = generic:load("objcop");
objcop_2035 = objcop:select_stages_by_year(2035);
Reshape Stages
$$ \operatorname{exp}=\operatorname{exp1:reshape\_stages}(\operatorname{Profile.DAILY}) $$
For an hourly represented data, the stage resolution can changed from a week, month or year level to a daily one using that method
| exp1 | exp |
|---|---|
n (daily-hourly) |
n (daily-hourly) |
n (weekly-hourly) |
7n (daily-hourly) |
n (monthly-hourly) |
~30n (daily-hourly) |
n (yearly-hourly) |
365n (daily-hourly) |
Example
thermal = Thermal();
gerter = thermal:load("gerter");
gerter_daily = gerter:reshape_stages(Profile.DAILY);
Agents
Aggregate All Agents
$$ \operatorname{exp}=\operatorname{exp1:aggregate\_agents}(\operatorname{f}, \operatorname{string}) $$
Example
hydro = Hydro();
gerhid = hydro:load("gerhid");
gerhid_sum = gerhid:aggregate_agents(BY_SUM(), "Total Hydro");
Aggregate Agents into Collection
$$ \operatorname{exp}=\operatorname{exp1:aggregate\_agents}(\operatorname{f}, \operatorname{collection}) $$
Where collection is Collection Enumerate.
Example
hydro = Hydro();
gerhid = hydro:load("gerhid");
gerhid_systems = gerhid:aggregate_agents(BY_SUM(), Collection.SYSTEM);
gerhid_buses = gerhid:aggregate_agents(BY_SUM(), Collection.BUSES);
Select One Agent by Name or Index
$$ \operatorname{exp}=\operatorname{exp1:select\_agent}(\text{string or int}) $$
Example
thermal = Thermal();
gerter = thermal:load("gerter");
gerter_t1 = gerter:select_agent("Thermal 1");
gerter_t2 = gerter:select_agent(2);
Select Mulitple Agents by Names or Indices
$$ \operatorname{exp}=\operatorname{exp1:select\_agents}(\{\text{string or int}, \text{string or int}, ...\}) $$
Example
thermal = Thermal();
gerter = thermal:load("gerter");
gerter_t1_and_t2 = gerter:select_agents({"Thermal 1", 2});
Select Agents within a Collection
$$ \operatorname{exp}=\operatorname{exp1:select\_agents}(\operatorname{collection}) $$
Where collection is Collection Enumerate.
Example
expansion_project = ExpansionProject()
outidec = expansion_project:load("outidec");
outidec_dclinks = outidec:select_agents(Collection.DCLINK);
Select Agents with a Query
$$ \operatorname{exp}=\operatorname{exp1:select\_agents}(\operatorname{string}) $$
Example
thermal = Thermal();
gerter = thermal:load("gerter");
non_zero_gerter = gerter:select_agents(gerter:ne(0));
Remove One Agent by Name or Index
$$ \operatorname{exp}=\operatorname{exp1:remove\_agent}(\text{string or int}) $$
Example
thermal = Thermal();
gerter = thermal:load("gerter");
gerter_t2_and_t3 = gerter:remove_agent("Thermal 1");
gerter_t1_and_t2 = gerter:remove_agent(3);
Remove Mulitple Agents by Names or Indices
$$ \operatorname{exp}=\operatorname{exp1:remove\_agents}(\{\text{string or int}, \text{string or int}, ...\}) $$
Example
thermal = Thermal();
gerter = thermal:load("gerter");
gerter_t1 = gerter:remove_agents({"Thermal 2", 3});
Rename One Agent
$$ \operatorname{exp}=\operatorname{exp1:rename\_agent}(\text{string}) $$
Rename Mulitple Agents with One Name
$$ \operatorname{exp}=\operatorname{exp1:rename\_agents}(\text{string}) $$
Rename Mulitple Agents with Mutiple Names
$$ \operatorname{exp}=\operatorname{exp1:rename\_agents}(\{\text{string}, \text{string}, ...\}) $$
Example
thermal = Thermal();
gerter = thermal:load("gerter");
gerter_renamed = gerter:rename_agents({"T1", "T2", "T3"});
Rename Mulitple Agents by Adding a Suffix
$$ \operatorname{exp}=\operatorname{exp1:add\_suffix}(\text{string}) $$
Rename Mulitple Agents by Adding a Prefix
$$ \operatorname{exp}=\operatorname{exp1:add\_prefix}(\text{string}) $$
Concatenate Agents
$$ \operatorname{exp}=\operatorname{concatenate}(\{\operatorname{exp1}, \operatorname{exp2}, ...\}) $$
Example 1
hydro = Hydro();
thermal = Thermal();
renewable = Renewable();

gerhid = hydro:load("gerhid");
gerter = thermal:load("gerter");
gergnd = renewable:load("gergnd");
generation = concatenate(gerhid, gerter, gergnd);
Aggregate Topology
$$ \operatorname{exp}=\operatorname{exp1:aggregate\_topology}(\operatorname{f}, \operatorname{topology}) $$
Where topology is the following enumerate:
| Topologies |
|---|
Topology.CONTROLLED_BY |
Topology.TURBINED_TO |
Topology.TURBINED_FROM |
Topology.SPILLED_TO |
Topology.SPILLED_FROM |
Topology.FILTRATION_TO |
Topology.ASSOCIATED_RESERVOIR |
Topology.NEUTRAL |
Topology.STORED_ENERGY_TO |
Example
hydro = Hydro();
production_factor = hydro:load("fprodt");
production_factor_accumulated = production_factor:aggregate_topology(BY_SUM(), Topology.TURBINED_TO);
Aggregate Topology with Min and Max Levels
$$ \operatorname{exp}=\operatorname{exp1:aggregate\_topology}(\operatorname{f}, \operatorname{topology}, \operatorname{min}, \operatorname{max}) $$
Example
hydro = Hydro();
spillage = hydro:load("qverti");
spillage_parents = spillage:aggregate_topology(BY_SUM(), Topology.TURBINED_FROM, 1, 1);
Others Dimensions
Moving Function
$$ \operatorname{exp}=\operatorname{exp1:moving}(\operatorname{f}, \operatorname{int}) $$
Example
system = System();
cmgdem = system:load("cmgdem");
cmgdem_12months = cmgdem:moving(BY_AVERAGE(), 12);
Saving
Save Options
| Description | Syntax | Default |
|---|---|---|
| Save output as BIN/HDR | bin |
true |
| Save output as CSV | csv |
false |
| Save output as DAT | dat |
false |
Save
$$ \operatorname{exp1:save}(\operatorname{string}) $$
Example
thermal = Thermal();
gerter = thermal:load("gerter");
gerter:save("example");
Save with Options
$$ \operatorname{exp1:save}(\operatorname{string}, \{\operatorname{options}\}) $$
Example
thermal = Thermal();
gerter = thermal:load("gerter");
gerter:save("example", { csv = true });
Save and Load into an Expression
$$ \operatorname{exp}=\operatorname{exp1:save\_and\_load}(\operatorname{string}) $$
Example
thermal = Thermal();
gerter = thermal:load("gerter");
example = gerter:save_and_load("example");
Save with Options and Load into an Expression
$$ \operatorname{exp}=\operatorname{exp1:save\_and\_load}(\operatorname{string}, \{\operatorname{options}\}) $$
Example
thermal = Thermal();
gerter = thermal:load("gerter");
example = gerter:save_and_load("example", { csv = true });
Save Cache
$$ \operatorname{exp}=\operatorname{exp1:save\_cache}() $$
Example
thermal = Thermal();
gerter = thermal:load("gerter");
cache = gerter:save_cache();
Dashboard
PSRIO provides a set of methods that allow users to analyze their results simply and easily.
Create a Tab
$$ \operatorname{tab}=\operatorname{Tab}(\text{string}) $$
Example
tab = Tab("Tab title");
Set the Tab Icon
$$ \operatorname{tab:set\_icon}(\text{string}) $$
Example
tab = Tab("Tab title");
tab:set_icon("home");
Disable the Tab
$$ \operatorname{tab:set\_disabled}() $$
Example
tab = Tab("Tab title");
tab:set_disabled();
Set the Collapse Flag
$$ \operatorname{tab:set\_collapsed}(\text{boolean}) $$
Example
tab = Tab("Tab title");
tab:set_collapsed(true);
Push a Chart to a Tab
$$ \operatorname{tab:push}(\text{chart}) $$
Example
tab = Tab("Tab title");
tab:push("home");
Push a Markdown to a Tab
$$ \operatorname{tab:push}(\text{string}) $$
Example
tab = Tab("Tab title");
tab:push("# Heading 1");
Push a Tab to a Tab
$$ \operatorname{tab:push}(\text{tab}) $$
Example
tab = Tab("Tab title");
subtab = Tab("Sub Tab title");
tab:push(subtab);
Create a Dashboard
$$ \operatorname{dashboard}=\operatorname{Dashboard}() $$
Example
dashboard = Dashboard();
Push a Tab to a Dashboard
$$ \operatorname{dashboard:push}(\operatorname{tab}) $$
Example
tab = Tab("Tab title");
dashboard = Dashboard();
dashboard:push(tab);
Save a Dashboard
$$ \operatorname{dashboard:save}(\text{string}) $$
Example
dashboard = Dashboard();
dashboard:save("example");
Charts
Charts are the essential elements of dashboards. They provide a visual way of analyzing the data generated by PSR models. To create a chart object, we should use one of the following methods:
| Method | Syntax |
|---|---|
| Create a Chart | chart = Chart() |
| Create a Chart with a title | chart = Chart("title") |
| Create a Chart with a title and a subtitle | chart = Chart("title", "subtitle") |
After creating the chart object, we can start to push the data in it. PSRIO gives multiple options for chart types, which can be seen below:
| Method | Syntax |
|---|---|
| Line | chart:add_line(exp) |
| Spline | chart:add_spline(exp) |
| Column | chart:add_column(exp) |
| Column Stacking | chart:add_column_stacking(exp) |
| Column Percent | chart:add_column_percent(exp) |
| Column Range | chart:add_column_range(exp1, exp2) |
| Categories | chart:add_categories(exp, "label") |
| Area | chart:add_area(exp) |
| Area Stacking | chart:add_area_stacking(exp) |
| Area Percent | chart:add_area_percent(exp) |
| Area Range | chart:add_area_range(exp1, exp2) |
| Area Spline | chart:add_area_spline(exp) |
| Area Spline Stacking | chart:add_area_spline_stacking(exp) |
| Area Spline Percent | chart:add_area_spline_percent(exp) |
| Area Spline Range | chart:add_area_spline_range(exp1, exp2) |
| Error Bar | chart:add_error_bar(exp1, exp2) |
| Pie | chart:add_pie(exp) |
| Histogram | chart:add_histogram(exp) |
| Heatmap | chart:add_heatmap(exp) |
| Scatter | chart:add_scatter(exp1, exp2, "label") |
| Probability of Exceedance | chart:add_probability_of_exceedance(exp) |
| Probability of Non Exceedance | chart:add_probability_of_nonexceedance(exp) |
| Box Plot | chart:add_box_plot(exp1, exp2, exp3, exp4, exp5) |
Examples
local thermal = Thermal();
local gerter = thermal:load("gerter");

local hydro = Hydro();
local gerhid = hydro:load("gerhid");

local renewable = Renewable();
local gergnd = renewable:load("gergnd");

local tab = Tab("Tutorial");

-- push charts to tab here --

local dashboard = Dashboard();
dashboard:push(tab);
dashboard:save("tutorial");
Example: Line
local chart = Chart("Line");
chart:add_line(gerter:aggregate_blocks(BY_SUM()):aggregate_scenarios(BY_AVERAGE()):select_largest_agents(5));
tab:push(chart);
Example: Spline
local chart = Chart("Spline");
chart:add_spline(gerter:aggregate_blocks(BY_SUM()):aggregate_scenarios(BY_AVERAGE()):select_largest_agents(5));
tab:push(chart);
Example: Column
local chart = Chart("Column");
chart:add_column(gerter:aggregate_blocks(BY_SUM()):aggregate_scenarios(BY_AVERAGE()):select_largest_agents(5));
tab:push(chart);
Example: Categories
local chart = Chart("Categories");
chart:add_categories(gerter:aggregate_blocks(BY_SUM()):aggregate_scenarios(BY_AVERAGE()):aggregate_agents(BY_SUM(), Collection.SYSTEM), "Thermal");
chart:add_categories(gerhid:aggregate_blocks(BY_SUM()):aggregate_scenarios(BY_AVERAGE()):aggregate_agents(BY_SUM(), Collection.SYSTEM), "Hydro");
chart:add_categories(gergnd:aggregate_blocks(BY_SUM()):aggregate_scenarios(BY_AVERAGE()):aggregate_agents(BY_SUM(), Collection.SYSTEM), "Renewable");
tab:push(chart);
Example: Column Stacking
local chart = Chart("Column Stacking");
chart:add_column_stacking(gerter:aggregate_blocks(BY_SUM()):aggregate_scenarios(BY_AVERAGE()):select_largest_agents(5));
tab:push(chart);
Example: Column Percent
local chart = Chart("Column Percent");
chart:add_column_percent(gerter:aggregate_blocks(BY_SUM()):aggregate_scenarios(BY_AVERAGE()):select_largest_agents(5));
tab:push(chart);
Example: Column Range
local chart = Chart("Column Range");
chart:add_column_range(
    gerter:aggregate_blocks(BY_SUM()):aggregate_agents(BY_SUM(), "p10"):aggregate_scenarios(BY_PERCENTILE(10)),
    gerter:aggregate_blocks(BY_SUM()):aggregate_agents(BY_SUM(), "p90"):aggregate_scenarios(BY_PERCENTILE(90))
);
tab:push(chart);
Example: Area
local chart = Chart("Area");
chart:add_area(gerter:aggregate_blocks(BY_SUM()):aggregate_scenarios(BY_AVERAGE()):select_largest_agents(5));
tab:push(chart);
Example: Area Stacking
local chart = Chart("Area Stacking");
chart:add_area_stacking(gerter:aggregate_blocks(BY_SUM()):aggregate_scenarios(BY_AVERAGE()):select_largest_agents(5));
tab:push(chart);
Example: Area Percent
local chart = Chart("Area Percent");
chart:add_area_percent(gerter:aggregate_blocks(BY_SUM()):aggregate_scenarios(BY_AVERAGE()):select_largest_agents(5));
tab:push(chart);
Example: Area Range
local chart = Chart("Area Range");
chart:add_area_range(
    gerter:aggregate_blocks(BY_SUM()):aggregate_agents(BY_SUM(), "p10"):aggregate_scenarios(BY_PERCENTILE(10)),
    gerter:aggregate_blocks(BY_SUM()):aggregate_agents(BY_SUM(), "p90"):aggregate_scenarios(BY_PERCENTILE(90))
);
tab:push(chart);
Example: Area Spline
local chart = Chart("Area Spline");
chart:add_area_spline(gerter:aggregate_blocks(BY_SUM()):aggregate_scenarios(BY_AVERAGE()):select_largest_agents(5));
tab:push(chart);
Example: Area Spline Stacking
local chart = Chart("Area Spline Stacking");
chart:add_area_spline_stacking(gerter:aggregate_blocks(BY_SUM()):aggregate_scenarios(BY_AVERAGE()):select_largest_agents(5));
tab:push(chart);
Example: Area Spline Percent
local chart = Chart("Area Spline Percent");
chart:add_area_spline_percent(gerter:aggregate_blocks(BY_SUM()):aggregate_scenarios(BY_AVERAGE()):select_largest_agents(5));
tab:push(chart);
Example: Area Spline Range
local chart = Chart("Area Spline Range");
chart:add_area_spline_range(
    gerter:aggregate_blocks(BY_SUM()):aggregate_agents(BY_SUM(), "p10"):aggregate_scenarios(BY_PERCENTILE(10)),
    gerter:aggregate_blocks(BY_SUM()):aggregate_agents(BY_SUM(), "p90"):aggregate_scenarios(BY_PERCENTILE(90))
);
tab:push(chart);
Example: Error Bar
local chart = Chart("Error Bar");
chart:add_error_bar(
    gerter:aggregate_blocks(BY_SUM()):aggregate_agents(BY_SUM(), "p10"):aggregate_scenarios(BY_PERCENTILE(10)),
    gerter:aggregate_blocks(BY_SUM()):aggregate_agents(BY_SUM(), "p90"):aggregate_scenarios(BY_PERCENTILE(90))
);
tab:push(chart);
Example: Pie
local chart = Chart("Pie");
chart:add_pie(gerter:aggregate_blocks(BY_SUM()):aggregate_scenarios(BY_AVERAGE()):aggregate_stages(BY_SUM()));
tab:push(chart);
Example: Histogram
local chart = Chart("Histogram");
chart:add_histogram(gerter:aggregate_blocks(BY_SUM()):aggregate_agents(BY_SUM(), "Total"));
tab:push(chart);
Example: Heatmap (Hourly)
local chart = Chart("Heatmap (Hourly)");
chart:add_heatmap(gerter:aggregate_scenarios(BY_AVERAGE()):aggregate_agents(BY_SUM(), "total"));
tab:push(chart);
Example: Heatmap (Daily)
local chart = Chart("Heatmap (Daily)");
chart:add_heatmap(gerter:reshape_stages(Profile.DAILY):aggregate_blocks(BY_SUM()):aggregate_scenarios(BY_AVERAGE()):aggregate_agents(BY_SUM(), "total"));
tab:push(chart);
Example: Heatmap (Scenario)
local chart = Chart("Heatmap (Scenario)");
chart:add_heatmap(gerter:aggregate_blocks(BY_SUM()):aggregate_agents(BY_SUM(), "total"));
tab:push(chart);
Example: Scatter Plot
local chart = Chart("Scatter Plot");
local x = gerter:aggregate_blocks(BY_SUM()):aggregate_agents(BY_SUM(), "Thermal"):aggregate_scenarios(BY_AVERAGE())
local y = gerhid:aggregate_blocks(BY_SUM()):aggregate_agents(BY_SUM(), "Hydro"):aggregate_scenarios(BY_AVERAGE())
chart:add_scatter(x, y, "Label");
tab:push(chart);
Example: Probability of Exceedance
local chart = Chart("Probability of Exceedance");
chart:add_probability_of_exceedance(gerter:aggregate_blocks(BY_SUM()));
tab:push(chart);
Example: Probability of Non Exceedance
local chart = Chart("Probability of Non Exceedance");
chart:add_probability_of_nonexceedance(gerter:aggregate_blocks(BY_SUM()));
tab:push(chart);
Example: Box Plot
local chart = Chart("Box Plot");
chart:add_box_plot(
    gerter:aggregate_blocks(BY_SUM()):aggregate_agents(BY_SUM(), "thermal"):aggregate_scenarios(BY_MIN()),
    gerter:aggregate_blocks(BY_SUM()):aggregate_agents(BY_SUM(), "thermal"):aggregate_scenarios(BY_PERCENTILE(25)),
    gerter:aggregate_blocks(BY_SUM()):aggregate_agents(BY_SUM(), "thermal"):aggregate_scenarios(BY_PERCENTILE(50)),
    gerter:aggregate_blocks(BY_SUM()):aggregate_agents(BY_SUM(), "thermal"):aggregate_scenarios(BY_PERCENTILE(75)),
    gerter:aggregate_blocks(BY_SUM()):aggregate_agents(BY_SUM(), "thermal"):aggregate_scenarios(BY_MAX())
);
tab:push(chart);
Example: Multiple (Line and Area Range)
local chart = Chart("Multiple (Line and Area Range)");
chart:add_area_range(
    gerter:aggregate_blocks(BY_SUM()):aggregate_agents(BY_SUM(), "p10"):aggregate_scenarios(BY_PERCENTILE(10)),
    gerter:aggregate_blocks(BY_SUM()):aggregate_agents(BY_SUM(), "p90"):aggregate_scenarios(BY_PERCENTILE(90))
);
chart:add_line(
    gerter:aggregate_blocks(BY_SUM()):aggregate_scenarios(BY_AVERAGE()):aggregate_agents(BY_SUM(), "avg")
);
tab:push(chart);
Example: Multiple (Line and Column)
local chart = Chart("Multiple (Line and Column)");
chart:add_column(gerter:aggregate_blocks(BY_SUM()):aggregate_scenarios(BY_AVERAGE()):aggregate_agents(BY_SUM(), "column"));
chart:add_line(gerter:aggregate_blocks(BY_SUM()):aggregate_scenarios(BY_AVERAGE()):aggregate_agents(BY_SUM(), "line"));
tab:push(chart);
Chart Attributes
Some methods accept arguments to customize your chart, i.e., change its color, define the limits on the y axis, etc.
The arguments are declared in tables inside the methods, as shown in the following example:
chart:add_line(exp, {lineWidth = 2}). The user can also define multiple arguments as follows chart:add_line(exp, {lineWidth = 2, color = "#8583ff"}). The following table describes the available chart arguments:
Layer Attributes
| Argument | Description |
|---|---|
color = ? |
e.g. #ff0000 or red |
lineWidth = ? |
0, 1, 2, ... |
marker = {enabled = ?} |
true or false |
marker = {symbol = ?} |
circle, square, diamond, triangle or triangle-down |
marker = {radius = ?} |
0, 1, 2, ... |
dataLabels = {enabled = ?} |
true or false |
dataLabels = {format = ?} |
e.g. "{point.y:,.0f}" |
fillOpacity = ? |
0.0 to 1.0 |
dashStyle = ? |
solid, shortdash, shortdot, shortdashdot, shortdashdotdot, dot, dash, longdash, dashdot, longdashdot, and longdashdotdo |
stops = { {?, ?}, ... } |
e.g. stops = {{0.0, "#3060cf"}, {0.5, "#fffbbc"}, {0.9, '#c4463a"}} |
showInLegend = ? |
true or false |
X Axis Attributes
| Argument | Description |
|---|---|
xAllowDecimals = ? |
true or false |
xGridLineWidth = ? |
0, 1, 2, ... |
xMin = ? |
The minimum value of the x axis |
xMax = ? |
The maximum value of the x axis |
Y Axis Attributes
| Argument | Description |
|---|---|
yAllowDecimals = ? |
true or false |
yMin = ? |
The minimum value of the y axis |
yMax = ? |
The maximum value of the y axis |
Examples
local system = System();
local cmgdem = system:load("cmgdem"):aggregate_scenarios(BY_AVERAGE());
local cmgdem_per_agent = cmgdem:aggregate_blocks(BY_AVERAGE());
local cmgdem_per_block = cmgdem:aggregate_agents(BY_SUM(), "Load Marginal Cost");
local cmgdem_aggregated = cmgdem:aggregate_blocks(BY_AVERAGE()):aggregate_agents(BY_SUM(), "Load Marginal Cost");

local tab = Tab("Tutorial");

-- push charts to tab here --

tab:save("tutorial");
Example: Single Color
local chart = Chart("Single Color");
chart:add_line(cmgdem_per_agent, {color = "#8583ff"});
tab:push(chart);
Example: Multiple Colors
local chart = Chart("Multiple Colors");
chart:add_line(cmgdem_per_agent, {color = {"#9b5de5", "#f15bb5", "#fee440", "#00bbf9", "#00f5d4"}});
tab:push(chart);
Example: Multiple Colors (interpolate)
local chart = Chart("Multiple Colors (interpolate)");
chart:add_line(cmgdem_per_agent, {color = PSR.interpolate_colors("#ff0000", "#00ff00", cmgdem_per_agent:agents_size())});
tab:push(chart);
Example: Line Width
local chart = Chart("Line Width");
chart:add_line(cmgdem_aggregated, {lineWidth = 8});
tab:push(chart);
Example: Marker
local chart = Chart("Marker");
chart:add_line(cmgdem_aggregated, {marker = {enabled = true, symbol = "circle", radius = 2}});
tab:push(chart);
Example: Data Labels
local chart = Chart("Data Labels");
chart:add_line(cmgdem_aggregated, {dataLabels = {enabled = true, format = "{point.y:,.0f}"} });
tab:push(chart);
Example: xGrid Line Width
local chart = Chart("xGrid Line Width");
chart:add_line(cmgdem_aggregated, {xGridLineWidth = 1});
tab:push(chart);
Example: Fill Opacity
local chart = Chart("Fill Opacity");
chart:add_area(cmgdem_aggregated, {fillOpacity = 1});
tab:push(chart);
Example: Dash Style
local chart = Chart("Dash Style");
chart:add_line(cmgdem_aggregated, {dashStyle = "dash"});
tab:push(chart);
Example: Show In Legend
local chart = Chart("Show In Legend");
chart:add_line(cmgdem_aggregated, {showInLegend = false});
tab:push(chart);
Example: Stops
local chart = Chart("Stops");
chart:add_heatmap(cmgdem_per_block, { stops = { {0.0, "#7EAB55"}, {0.2, "#FFFE55"}, {0.4, "#F5C142"}, {0.6, "#DF8244"}, {0.8, "#B02418"} } });
tab:push(chart);
Markdown
Headers
# h1 Heading
## h2 Heading
### h3 Heading
#### h4 Heading
##### h5 Heading
###### h6 Heading
h1 Heading
h2 Heading
h3 Heading
h4 Heading
h5 Heading
h6 Heading
Horizontal Rules
___

---

***
Emphasis
*This text will be italic*
_This will also be italic_
**This text will be bold**
__This will also be bold__
*You **can** combine them*
~~This text will be strikethrough~~
This text will be italic
This will also be italic
This text will be bold
This will also be bold
You can combine them
This text will be strikethrough
Unordered List
+ Create a list by starting a line with `+`, `-`, or `*`
+ Sub-lists are made by indenting 2 spaces:
  - Marker character change forces new list start:
    * Ac tristique libero volutpat at
    + Facilisis in pretium nisl aliquet
    - Nulla volutpat aliquam velit
+ Very easy!
- Create a list by starting a line with
+,-, or* - Sub-lists are made by indenting 2 spaces:
- Marker character change forces new list start:
- Ac tristique libero volutpat at
- Facilisis in pretium nisl aliquet
- Nulla volutpat aliquam velit
- Marker character change forces new list start:
- Very easy!
Ordered List
1. Item 1
2. Item 2
3. Item 3
    * Item 3a
    * Item 3b
- Item 1
- Item 2
- Item 3
- Item 3a
- Item 3b
Links
[link text](http://psr-inc.com)

[link with tooltip](http://psr-inc.com/ "tooltip text!")

Autoconverted link http://psr-inc.com (enable linkify to see)
Autoconverted link http://psr-inc.com (enable linkify to see)
Blockquotes
> Blockquotes can also be nested...
>> ...by using additional greater-than signs right next to each other...
> > > ...or with spaces between arrows.
Blockquotes can also be nested...
...by using additional greater-than signs right next to each other...
...or with spaces between arrows.
Code
Inline `code`

    // Indented code
    line 1 of code
    line 2 of code
    line 3 of code

```
Block code
```
Inline code
// Indented code
line 1 of code
line 2 of code
line 3 of code
Block code
Tables
| Option | Description                                                               |
|--------|---------------------------------------------------------------------------|
| data   | path to data files to supply the data that will be passed into templates. |
| engine | engine to be used for processing templates. Handlebars is the default.    |
| ext    | extension to be used for dest files.                                      |
| Option | Description |
|---|---|
| data | path to data files to supply the data that will be passed into templates. |
| engine | engine to be used for processing templates. Handlebars is the default. |
| ext | extension to be used for dest files. |
Images


![Alt text][id]
[id]: https://octodex.github.com/images/dojocat.jpg "The Dojocat"


Equations
https://katex.org/docs/supported.html
dashboard:push("$$ x^2 + y^2 = z^2 $$");
$$ x^2 + y^2 = z^2 $$
dashboard:push("$$ \sqrt{x^2+1} $$");
$$ \sqrt{x^2+1} $$
dashboard:push("$$ \int\limits_0^1 x^2 + y^2 dx $$");
$$ \int\limits_0^1 x^2 + y^2 dx $$
dashboard:push("$$ \int_0^1 x^2 + y^2 dx $$");
$$ \int_0^1 x^2 + y^2 dx $$
dashboard:push("$$ a_1^2 + a_2^2 = a_3^2 $$");
$$ a_1^2 + a_2^2 = a_3^2 $$
dashboard:push("$$ \sum_{i=1}^{\infty} \frac{1}{n^s} = \prod_p \frac{1}{1 - p^{-s}} $$");
$$ \sum_{i=1}^{\infty} \frac{1}{n^s} = \prod_p \frac{1}{1 - p^{-s}} $$
dashboard:push("$$ \begin{matrix} a & b \\\\ c & d \end{matrix} $$");
$$ \begin{matrix} a & b \\ c & d \end{matrix} $$
PSRIO Base
PSRIO Base is a library embedded with PSRIO that provides implementations of PSR model outputs. Instead of rewriting recipes or searching for written similar scripts, we can use the functions provided by PSRIO Base. We use the function require to load the scripts defined in the PSRIO Base.
Example: Useful Storage
useful_storage = require("sddp/useful_storage");
useful_storage():save("useful_storage");
Example: Circuit Loading
usecir = require("sddp/usecir");
usecir():save("usecir");
Example: Hydro Generation per Bus
gerhid_per_bus = require("sddp/gerhid_per_bus");
gerhid_per_bus():save("gerhid_per_bus");
Example: Deficit Risk per Year
defcit_risk = require("sddp/defcit_risk");
defcit_risk():save("defcit_risk");
Example: Load Marginal Cost Report
sddpcmgd = require("sddp-reports/sddpcmgd");
sddpcmgd():save("sddpcmgd");
Example: Averaged Load Marginal Cost Report
sddpcmga = require("sddp-reports/sddpcmga");
sddpcmga():save("sddpcmga");
Examples
Example: Thermal Generation per Fuel
thermal = Thermal();
gerter = thermal:load("gerter");
gerter:aggregate_agents(BY_SUM(), Collection.FUEL):save("gerter_per_fuel");
Example: Renewable Generation per Technology
renewable = Renewable();
gergnd = renewable:load("gergnd");

general = renewable.tech_type:eq(0);
wind = renewable.tech_type:eq(1);
solar = renewable.tech_type:eq(2);
biomass = renewable.tech_type:eq(3);
small_hydro = renewable.tech_type:eq(4);
concentrated_solar_power = renewable.tech_type:eq(5);

concatenate(
    gergnd:select_agents(general):aggregate_agents(BY_SUM(), "General"),
    gergnd:select_agents(wind):aggregate_agents(BY_SUM(), "Wind"),
    gergnd:select_agents(solar):aggregate_agents(BY_SUM(), "Solar"),
    gergnd:select_agents(biomass):aggregate_agents(BY_SUM(), "Biomass"),
    gergnd:select_agents(small_hydro):aggregate_agents(BY_SUM(), "Small Hydro"),
    gergnd:select_agents(concentrated_solar_power):aggregate_agents(BY_SUM(), "CSP")
):save("gergnd_per_technology");
Example: Select All December Stages
generic = Generic();
output = generic:load("cmgdem");
first_stage = output:first_stage();
last_stage = output:last_stage();

selected_stages = {};
for stage = first_stage, last_stage do
    if output:month(stage) == 12 then
        table.insert(selected_stages, stage);
    end
end

output:stages_to_agents(selected_stages):save("example");
Example: Custom Chart 1
local system = System();
local cmgdem = system:load("cmgdem"):aggregate_blocks(BY_AVERAGE());
local p10 = cmgdem:aggregate_scenarios(BY_PERCENTILE(10)):aggregate_agents(BY_SUM(), "p10");
local p25 = cmgdem:aggregate_scenarios(BY_PERCENTILE(25)):aggregate_agents(BY_SUM(), "p25");
local p50 = cmgdem:aggregate_scenarios(BY_PERCENTILE(50)):aggregate_agents(BY_SUM(), "p50");
local p75 = cmgdem:aggregate_scenarios(BY_PERCENTILE(75)):aggregate_agents(BY_SUM(), "p75");
local p90 = cmgdem:aggregate_scenarios(BY_PERCENTILE(90)):aggregate_agents(BY_SUM(), "p90");
local chart = Chart("Custom Chart 1");

chart:add_area_range(p10, p90, { color = "blue", lineWidth = 0, fillOpacity = 0.2 });
chart:add_area_range(p25, p75, { color = "blue", lineWidth = 0, fillOpacity = 0.2 });
chart:add_line(p50, { color = "red", lineWidth = 2, dashStyle = "dash" });
Example: Custom Chart 2
local system = System();
local cmgdem = system:load("cmgdem"):aggregate_blocks(BY_AVERAGE());
local p10 = cmgdem:aggregate_scenarios(BY_PERCENTILE(10)):aggregate_agents(BY_SUM(), "p10");
local p90 = cmgdem:aggregate_scenarios(BY_PERCENTILE(90)):aggregate_agents(BY_SUM(), "p90");
local avg = cmgdem:aggregate_scenarios(BY_AVERAGE()):aggregate_agents(BY_SUM(), "Average");
local chart = Chart("Custom Chart 2");

local options = {
    xGridLineWidth = 1
};
chart:add_error_bar(p10, p90, options);

local options = {
    color = "green",
    lineWidth = 0,
    marker = { enabled = true, symbol = "rect" }
};
chart:add_line(p10, options);

local options = {
    color = "red",
    lineWidth = 0,
    marker = { enabled = true, symbol = "triangle" }
};
chart:add_line(p90, options);

local options = {
    color = "blue",
    lineWidth = 0,
    marker = { enabled = true, symbol = "circle" },
    dataLabels = { enabled = true, format = "{point.y:,.0f}" }
};
chart:add_line(avg, options);
Example: Custom Chart 3
local system = System();
local cmgdem = system:load("cmgdem"):aggregate_blocks(BY_AVERAGE());
local p10 = cmgdem:aggregate_scenarios(BY_PERCENTILE(10)):aggregate_agents(BY_SUM(), "p10");
local p50 = cmgdem:aggregate_scenarios(BY_PERCENTILE(50)):aggregate_agents(BY_SUM(), "p50");
local p90 = cmgdem:aggregate_scenarios(BY_PERCENTILE(90)):aggregate_agents(BY_SUM(), "p90");
local chart = Chart("Custom Chart 3");

chart:add_error_bar(p10, p90, { color = "black" });
chart:add_line(p50, { color = "grey", marker = { enabled = true, symbol = "circle" } });
Time Series
Constructor
$$ \operatorname{timeseries}=\operatorname{TimeSeries}() $$
Save
$$ \operatorname{timeseries:save}(\operatorname{string}) $$
Add Expression
$$ \operatorname{timeseries:add}(\operatorname{exp}) $$
Example
generic = Generic();
cmgdem = generic:load("cmgdem");
cmgdem = cmgdem:aggregate_scenarios(BY_AVERAGE());
cmgdem = cmgdem:aggregate_blocks(BY_AVERAGE());
cmgdem = cmgdem:aggregate_agents(BY_SUM(), "Load Marginal Cost");
cmgdem = cmgdem:add_suffix(" (" .. cmgdem:unit() .. ")");

gerter = generic:load("gerter");
gerter = gerter:aggregate_scenarios(BY_AVERAGE());
gerter = gerter:aggregate_blocks(BY_SUM());
gerter = gerter:aggregate_agents(BY_SUM(), "Thermal Generation");
gerter = gerter:add_suffix(" (" .. gerter:unit() .. ")");

timeseries = TimeSeries();
timeseries:add(gerter);
timeseries:add(cmgdem);
timeseries:save("example");
example.csv:
Datetime        , Thermal Generation (GWh), Load Marginal Cost ($/MWh)
2019-04-09 00:00, 99.707000               , 167.770000
2019-04-16 00:00, 97.036000               , 181.197000
2019-04-23 00:00, 117.266000              , 205.882000
2019-04-30 00:00, 117.625000              , 230.813000
2019-05-07 00:00, 122.800000              , 242.538000
2019-05-14 00:00, 140.680000              , 309.360000
...
Relational
Constructor
$$ \operatorname{relational}=\operatorname{Relational}() $$
Save
$$ \operatorname{relational:save}(\operatorname{string}) $$
Add Collection Column
$$ \operatorname{relational:add}(\operatorname{string}, \operatorname{study}, \operatorname{collection}) $$
Example
study = Study();

relational = Relational();
relational:add("hydro", study, Collection.HYDRO);
relational:save("example.csv");
example.csv:
hydro
La Estrella
Los Valles
Fortuna
Bayano
Estí
Esperanza
Concepción
...
Add Relationship Between Collections Column
$$ \operatorname{relational:add}(\operatorname{string}, \operatorname{study}, \operatorname{collection}, \operatorname{collection}) $$
Example
study = Study();

relational = Relational();
relational:add("hydro", study, Collection.HYDRO);
relational:add("system", study, Collection.HYDRO, Collection.SYSTEM);
relational:save("example.csv");
example.csv:
hydro,       system
La Estrella, PANAMA
Los Valles , PANAMA
Fortuna,     PANAMA
Bayano,      BAYSIS
Estí,        PANAMA
Esperanza,   PANAMA
Concepción,  PANAMA
...
Add Expression Column
$$ \operatorname{relational:add}(\operatorname{string}, \operatorname{expression}) $$
Example
renewable = Renewable();
study = Study();

relational = Relational();
relational:add("Name", study, Collection.RENEWABLE);
relational:add("System", study, Collection.RENEWABLE, Collection.SYSTEM);
relational:add("Code", renewable.code);
relational:add("Tech Type", renewable.tech_type);
relational:save("example.csv");
example.csv:
Name,         System, Code, Tech Type
Rosa de L V,  PANAMA, 1.0,  0.0
Marañon,      PANAMA, 2.0,  0.0
Nuevo Chagre, PANAMA, 3.0,  0.0
Portobello,   PANAMA, 4.0,  0.0
Sarigua,      PANAMA, 5.0,  0.0
Nuevo Ch 2,   PANAMA, 6.0,  0.0
...
TOML
Load from Collection
$$ \operatorname{toml}=\operatorname{collection:load\_toml}(\operatorname{filename}) $$
Contains
$$ \operatorname{boolean}=\operatorname{toml:contains}(\operatorname{key}) $$
Get String
$$ \operatorname{string}=\operatorname{toml:get\_string}(\operatorname{key}) $$
Get String with Fallback
$$ \operatorname{string}=\operatorname{toml:get\_string}(\operatorname{key}, \operatorname{fallback}) $$
Get Boolean
$$ \operatorname{boolean}=\operatorname{toml:get\_boolean}(\operatorname{key}) $$
Get Boolean with Fallback
$$ \operatorname{boolean}=\operatorname{toml:get\_boolean}(\operatorname{key}, \operatorname{fallback}) $$
Get Integer
$$ \operatorname{integer}=\operatorname{toml:get\_integer}(\operatorname{key}) $$
Get Integer with Fallback
$$ \operatorname{integer}=\operatorname{toml:get\_integer}(\operatorname{key}, \operatorname{fallback}) $$
Get Real
$$ \operatorname{double}=\operatorname{toml:get\_real}(\operatorname{key}) $$
Get Real with Fallback
$$ \operatorname{double}=\operatorname{toml:get\_real}(\operatorname{key}, \operatorname{fallback}) $$
Get Array Size
$$ \operatorname{integer}=\operatorname{toml:get\_array\_size}(\operatorname{key}) $$
Get Array
$$ \operatorname{array}=\operatorname{toml:get\_array}(\operatorname{key}) $$
Compare
Constructor
$$ \operatorname{compare}=\operatorname{Compare}(\operatorname{title}) $$
Set Relative Tolerance
$$ \operatorname{compare:set\_relative\_tolerance}(\operatorname{number}) $$
Set Absolute Tolerance
$$ \operatorname{compare:set\_absolute\_tolerance}(\operatorname{number}) $$
Add Expression
$$ \operatorname{compare:add}(\operatorname{exp}) $$
Report
Constructor
$$ \operatorname{report}=\operatorname{Report}(\operatorname{title}) $$
Add Header
$$ \operatorname{report:add\_header}(\operatorname{number}) $$
Push Comparison to Report
$$ \operatorname{report:push}(\operatorname{compare}) $$
Save
$$ \operatorname{report:save}(\operatorname{filename}) $$
Save with Header Flag
$$ \operatorname{report:save}(\operatorname{filename}, \operatorname{boolean}) $$
Example
generic1 = Generic(1);
generic2 = Generic(2);

report = Report("Case 1 vs Case 2");

cmgdem1 = generic1:load("cmgdem");
cmgdem2 = generic2:load("cmgdem");

compare = Compare("Load Marginal Cost");
compare:add(cmgdem1);
compare:add(cmgdem2);
report:push(compare);

gerter1 = generic1:load("gerter");
gerter2 = generic2:load("gerter");

compare = Compare("Thermal Generation");
compare:add(gerter1);
compare:add(gerter2);
report:push(compare);

report:save("compare");