PSRIO - v0.18.0
Introduction
PSRIO is a scripting language develop on top of LUA designed for:
- Querying data held in PSR databases (inputs and outputs)
- Perform several user-specified mathematical, statistical and data processing operations
- Produce new customized outputs in the same format as the SDDP outputs, that can be processed by the plotting tool
The main objective of this tool is to automate and standardize everyday operations by delegating tasks to an easy-to-use and secure language, avoiding manual errors and repeated work.
Additionally, PSRIO also enables the direct creation of dashboards.
What is a Scripting Language?
- Dynamic typing, structures, and binding (vs static)
- Flexibility (vs robustness)
- Programmer efficiency (vs computer efficiency)
- Interpreted (vs compiled)
- Faster cycle “edit-run-test”
- Automatic memory management
- Avoids several common bugs (overflows)
- Interface to other languages/programs
Why Scripting?
- No language is optimal for everything
- Programming languages are complex engineering projects
- Extend your application beyond compile time (“glue language”):
- System language implements the hard parts (components change little)
- Scripting language connects those parts (final applications change much)
- Quick-and-dirt programming (exploratory and rapid prototyping)
- Friendliness and easiness to end-user programming
- Examples: Shell/Bash in Unix, NumPy in Python
LUA

- A scripting language designed by Roberto Ierusalimschy, Luiz H. de Figueiredo, and Waldemar Celes at Tecgraf/PUC-Rio
- "The simplest thing that could possibly work"
- Simple, yet powerful, language for embedding and extending applications
- Portable and small, written in ANSI C, easy to integrate with C/C++
- TIOBE Index for May 2022:
- 1st Python; 2nd C; 3rd Java; 4th C++; 5th C#; 7th JavaScript; 18th Lua; 25th Julia; 30th Fortran
- Widely used in Triple-A games and small devices (embedded systems and IoT)
Scripting + LUA + PSR = PSRIO
- Treating code as data: every time you build a query, you're treating code as data
- C++ code implements the complex and stable parts:
- Data reading and processing, relationships, data structures, unit converting, and dashboarding
- Lua connects those parts: flexible, easy to change
Support or Contact
Having trouble with PSRIO? Contact our support team via sddp@psr-inc.com and we'll help you sort it out.
Getting Started
Creating a Script
As an introduction to PSRIO, we will show you how to create PSRIO recipes from scratch using the output data from example cases inside the SDDP installation folder. The example case 20 will be used for the explanation. It consists, basically, of one system containing three thermal plants supplying energy to consumers. Twelve stages constitute the study horizon, and the execution is deterministic.
Example
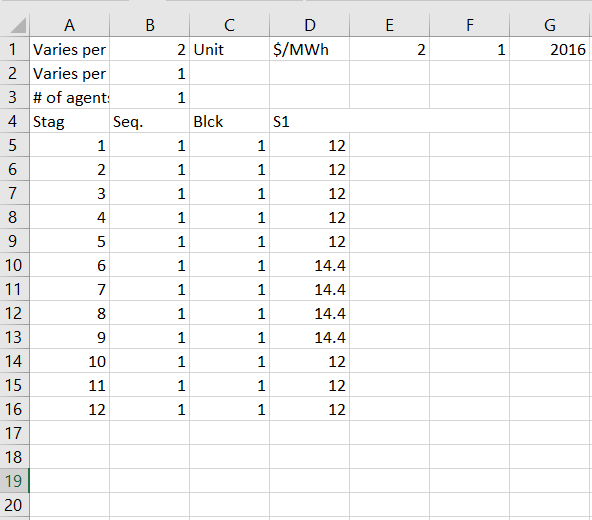
The first example is about demand's marginal cost. We want to get an average value within the stages of the file cmgdem.csv. Therefore, since this output is a system-level variable, we can start loading the system collections with the following command:
system = System();
Then, we load the marginal cost data from the file cmgdem.csv:
cmgdem = system:load("cmgdem");
The data can be seen in the image below:
The processing is accomplished using the method aggregate_stages, with the parameter BY_AVERAGE():
cmgdem_avg = cmgdem:aggregate_stages(BY_AVERAGE());
We save the expression with the following method, and the PSRIO will output the cmgdem_avg.bin and cmgdem_avg.hdr.
cmgdem_avg:save("cmgdem_avg");
If we want to save a CSV file, we should use the additional parameter:
cmgdem_avg:save("cmgdem_avg", {csv=true});
Let's see what the final result looks like:
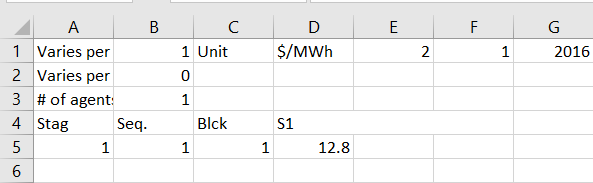
As we can see, the stages collapsed into one single value representing the average value of the demand marginal costs over the study horizon.
Example
Suppose we want to extract the total amount of energy generated by the plants based on the information received from SDDP about the generations in each stage of each plant, which we found in the file gerter.csv. The first step is to load the thermal collection with the following command:
thermal = Thermal();
Now, we have access to the attributes of each thermal plant in the system. As our interest lies in the generation, we will load the thermal generation data with the command:
gerter = thermal:load("gerter");
Check the data contained in the file:
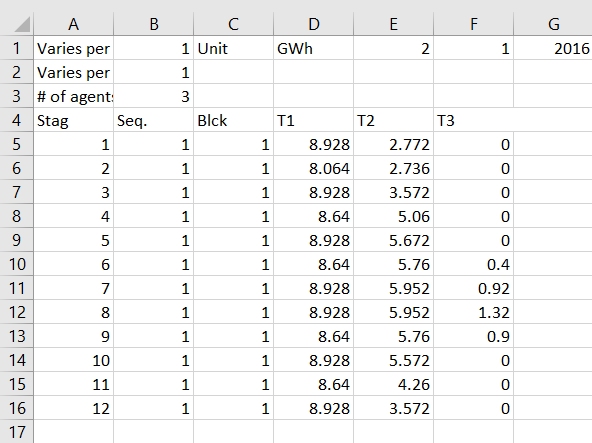
Notice that we managed to load the generation data by informing the filename of the output. Now, we can make operations with the thermal generation data. We want to sum the values of each plant regarding one stage so that there is only one value per stage representing the total generation of the system.
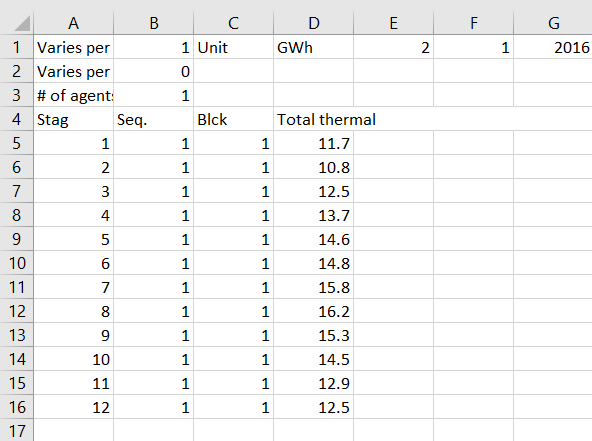
total_gerter = gerter:aggregate_agents(BY_SUM(), "Total thermal");

total_gerter:save("total_gerter", {csv=true});
The first instruction is to aggregate agents, summing their respective generations for each stage. In the subsequent command, we are saving the data stored in the variable total_gerter to the file total_gerter.csv. The processed data looks like this:
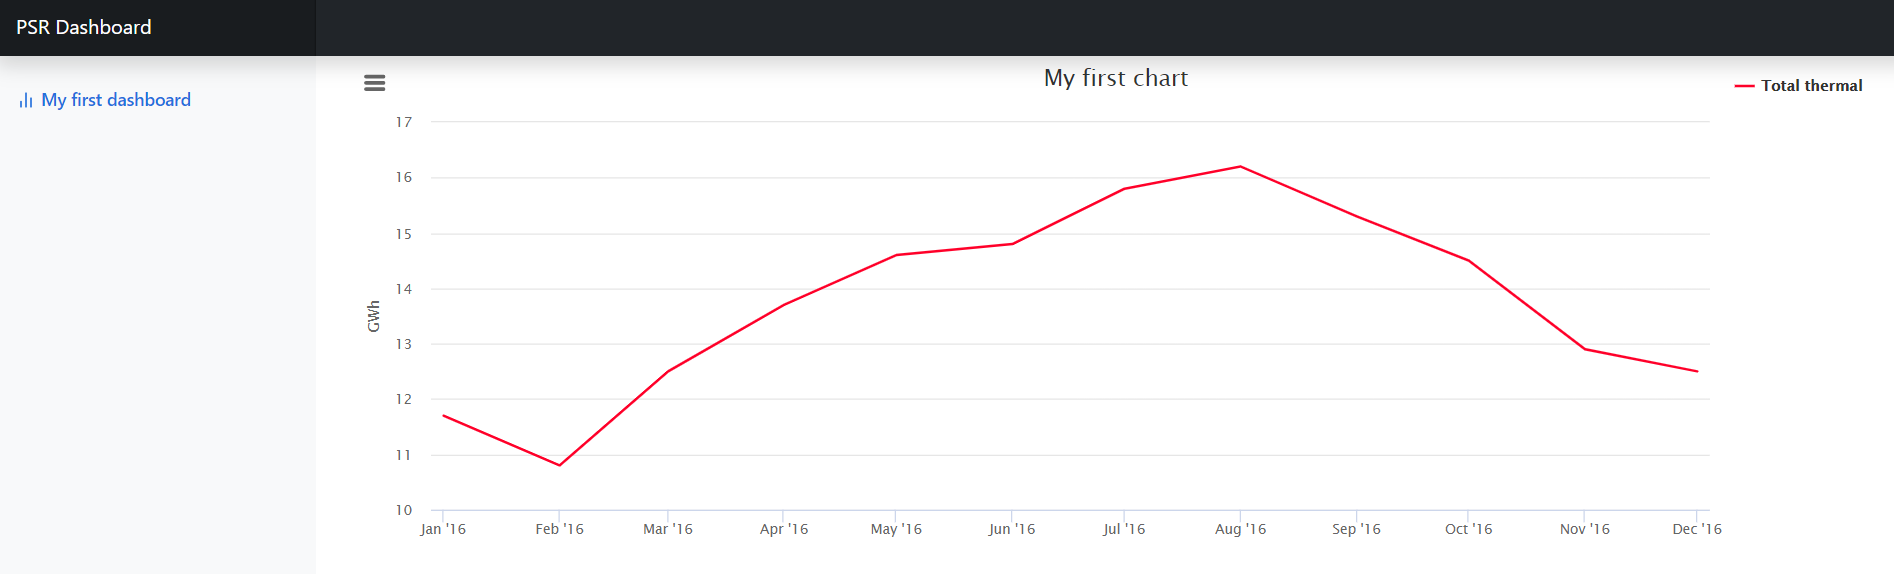
The best way to visualize the output is by plotting the data, making one of them. First, let’s define an object for the chart.
chart = Chart("My first chart");
We indicate to the chart object that we want to plot the data in the file variable total_gerter, which we have just created.
chart:add_line(total_gerter);
After that, we will define a tab object to hold chart objects information and then add the chart and save it to the file thermal_report.html.
tab = Tab("My first tab");
tab:push(chart);
tab:save("thermal_report");
By clicking in the file thermal_report.html, that's what we get:
In short, the recipe for this work is as follows:
-- load thermal collections and thermal generation data
thermal = Thermal();
gerter = thermal:load("gerter");

-- aggregate agents generations by sum and save to output file
total_gerter = gerter:aggregate_agents(BY_SUM(), "Total thermal");
total_gerter:save("total_gerter", {csv=true});

-- create chart object
chart = Chart("My first chart");

-- add total generation info
chart:add_line(total_gerter);

-- create dashboad object
tab = Tab("My first tab");

-- add chart and save to html file
tab:push(chart);
tab:save("thermal_report");
There are two ways to run the script above. We are now going to explain each one of them in the next section of this tutorial.
Running a script
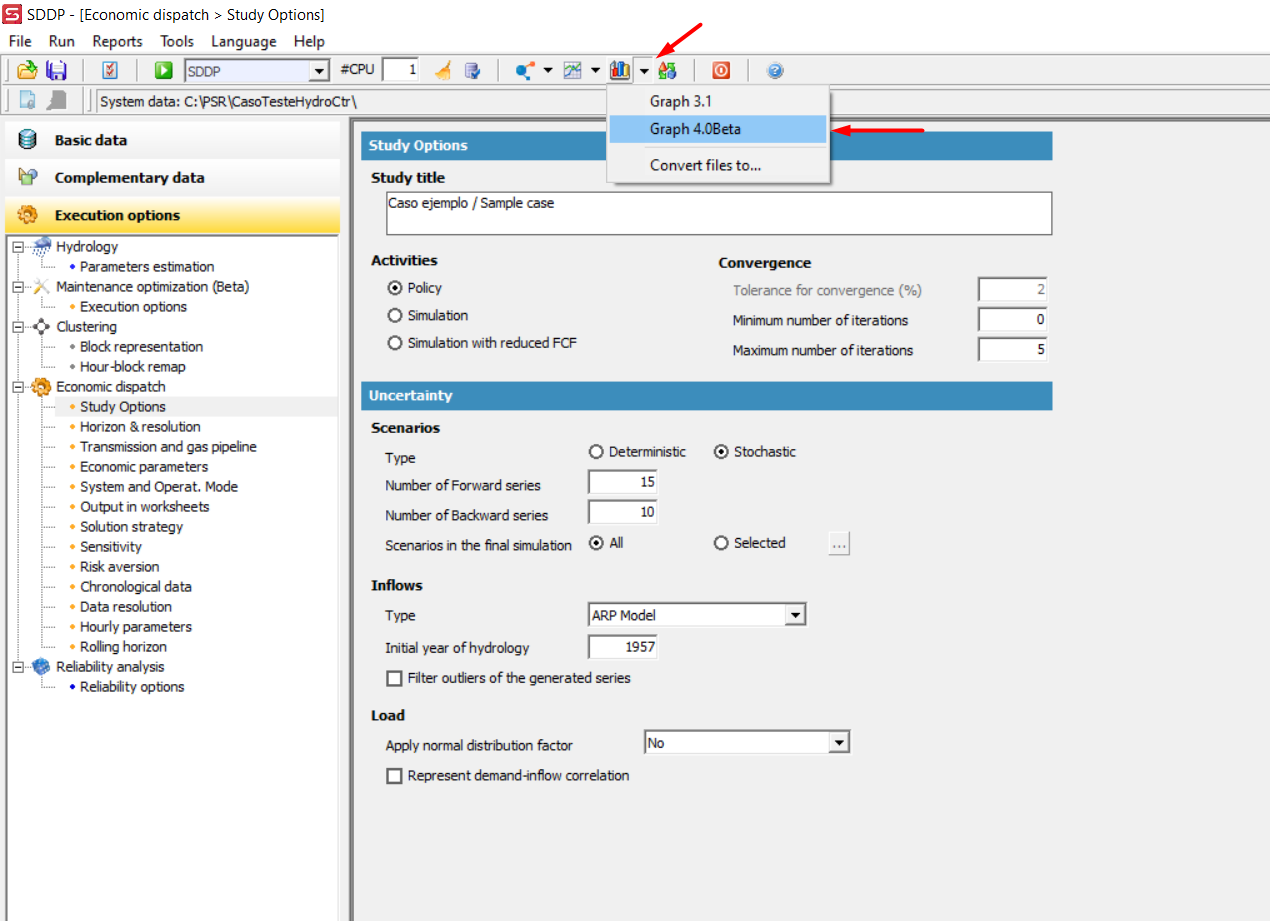
Graph 4.0
Graph 4.0 is a graphing tool that allows us to make PSRIO scripts inside an editor. After the execution of SDDP, open Graph 4.0:
Select the PSRIO editor option in the menu located on the left side of your screen:
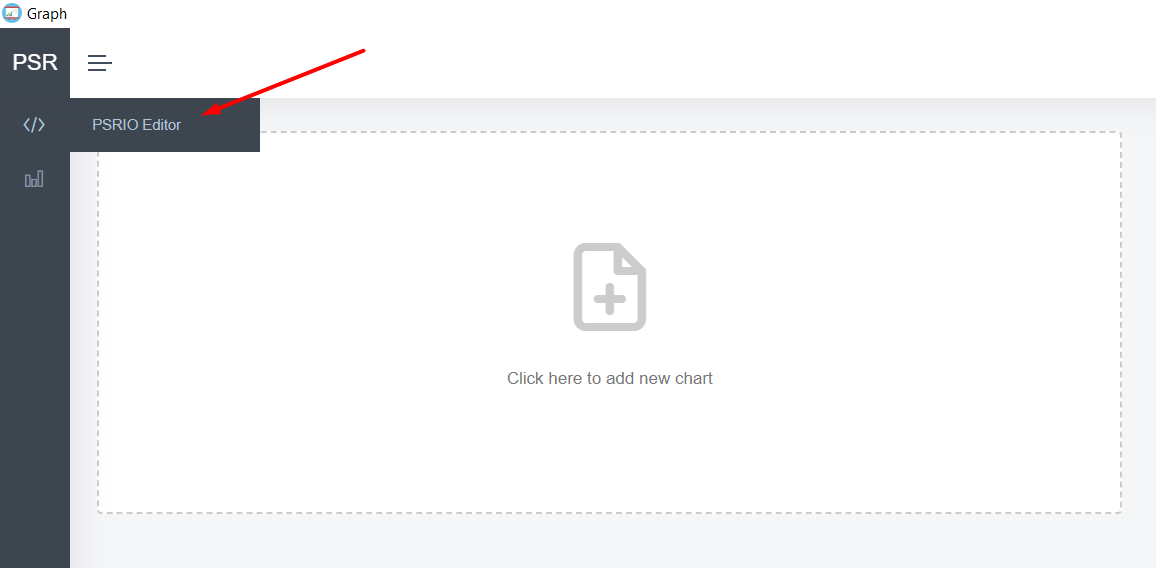
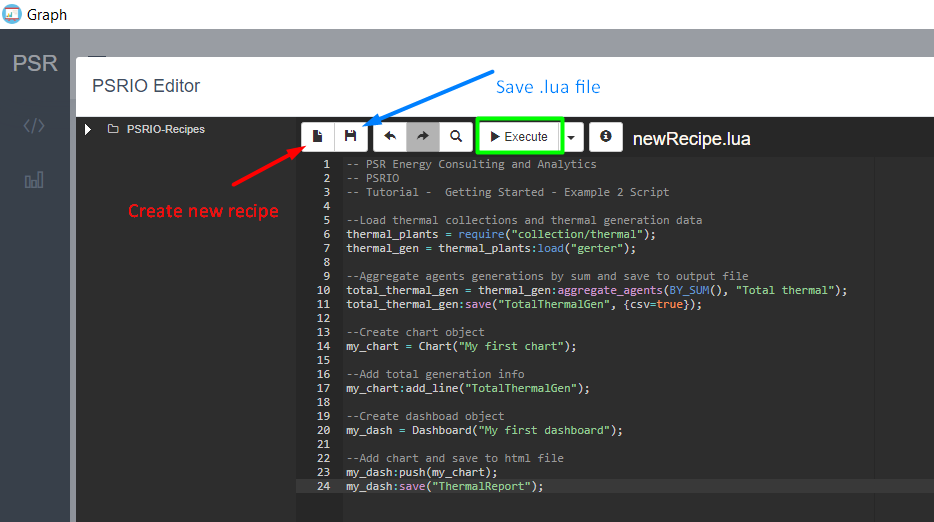
You can create a new script, write down the code, save it, and then you will be ready to go.
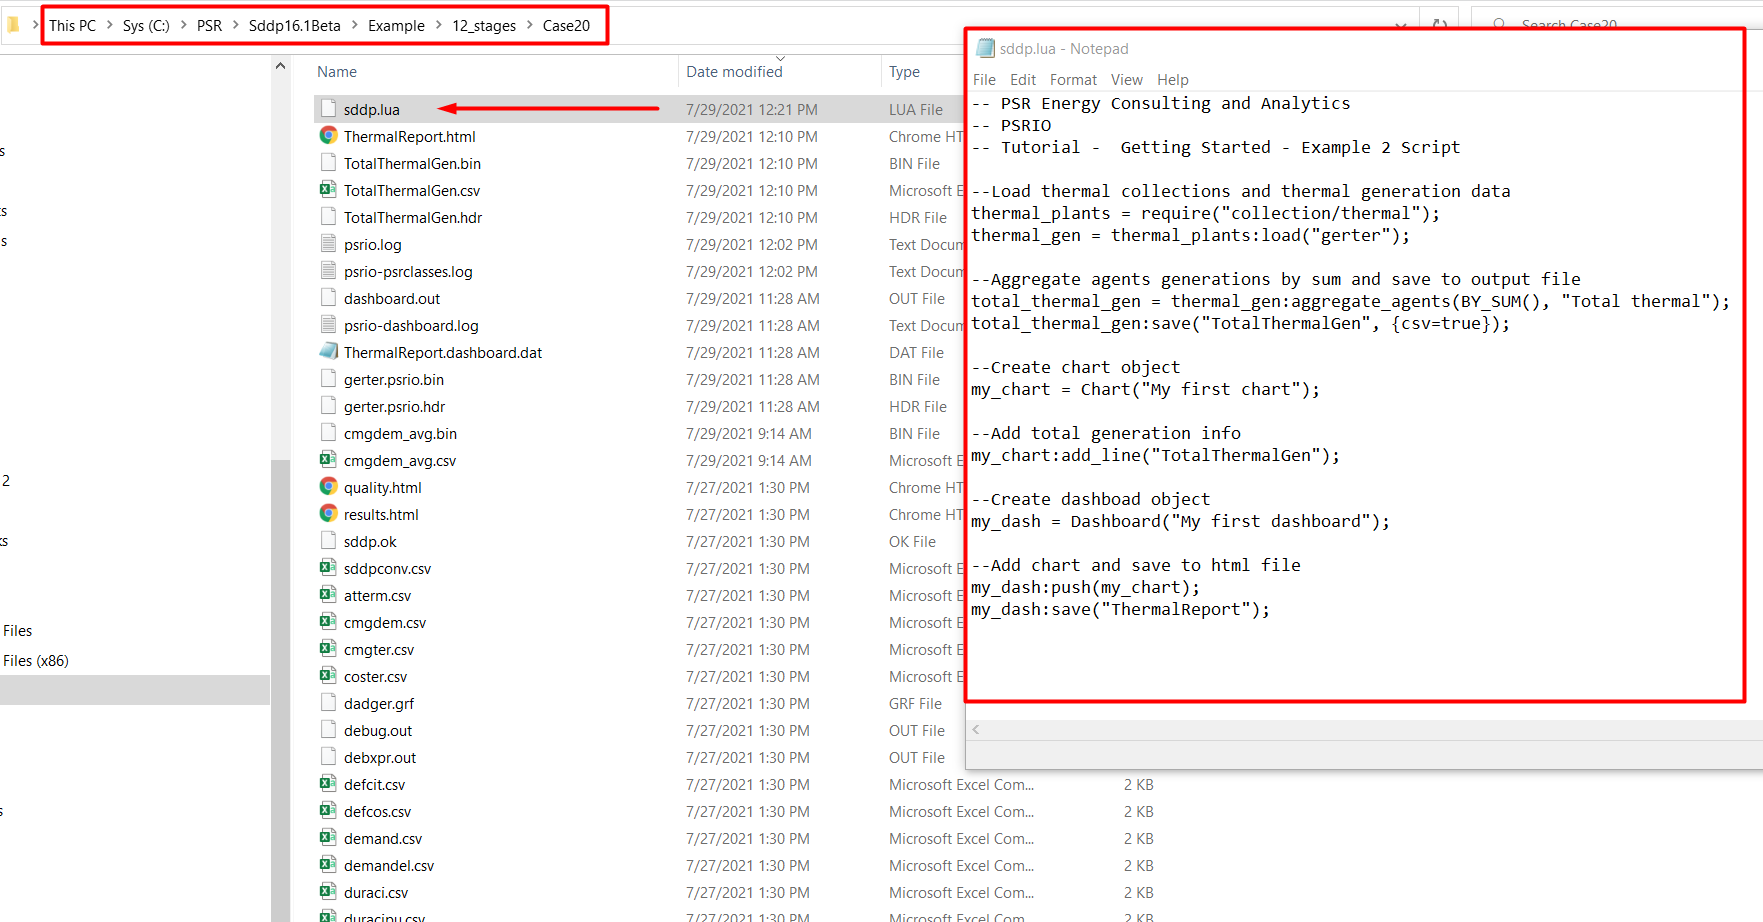
SDDP
We can run a PSRIO script automatically after an SDDP execution. To do it, we need to save an sddp.lua file in the case folder. The SDDP model will run this script and produce the outputs and tab defined on it.
Attributes
Attributes are properties that characterize an object or, in the context of PSRIO, an expression. Expressions related to results of a PSR model, whose data can change over stages, scenarios, and blocks, for example, have a set of attributes in PSRIO that can be useful in some tasks. In the example below, we load the thermal generation:
thermal = Thermal();
gerter = thermal:load("gerter");
And the log shows some expression's attributes information:
[info] Loading gerter (stages: 12 [1:12] [monthly] [10/2016], blocks: hour, scenarios: 1200, unit: GWh, agents: 3 [thermal])
From the log, it is possible to see that gerter has:
- 12 stages in a month-level resolution
- initial stage in 10/2016
- blocks
- 1200 scenarios
- generation data given in GWh
- 3 agents
All attributes related to stages, block, scenarios, agents and units of an expression and their respective methods are presented in the tables below.
Stage
| Method | Type | Syntax |
|---|---|---|
| Stages | number | attribute = exp:stages() |
| Stage | number | attribute = exp:stage(index) |
| Stage Type | number | attribute = exp:stage_type() |
| Initial Stage | number | attribute = exp:initial_stage() |
| Initial Year | number | attribute = exp:initial_year() |
| Final Year | number | attribute = exp:final_year() |
| Week | number | attribute = exp:week(stage) |
| Month | number | attribute = exp:month(stage) |
| Year | number | attribute = exp:year(stage) |
Example
stages = gerter:stages() -- 12

stage1 = gerter:stage(1) -- 10
stage2 = gerter:stage(2) -- 11
stage3 = gerter:stage(3) -- 12
stage4 = gerter:stage(4) -- 13

stage_type = gerter:stage_type() -- 2 (monthly)

initial_stage = gerter:initial_stage() -- 10
initial_year = gerter:initial_year() -- 2016
final_year = gerter:final_year() -- 2017

month1 = gerter:month(1) -- 10
month2 = gerter:month(2) -- 11
month3 = gerter:month(3) -- 12
month4 = gerter:month(4) --  1

year1 = gerter:year(1) -- 2016
year4 = gerter:year(4) -- 2017
Blocks
| Method | Type | Syntax |
|---|---|---|
| Blocks | number | attribute = exp:blocks(stage) |
| Has blocks | boolean | attribute = exp:has_blocks() |
| Is hourly | boolean | attribute = exp:is_hourly() |
Example
blocks1 = gerter:blocks(1) -- 744
blocks2 = gerter:blocks(2) -- 720

has_blocks = gerter:has_blocks() -- true

is_hourly = gerter:is_hourly() -- true
Scenarios
| Method | Type | Syntax |
|---|---|---|
| Scenarios | number | attribute = exp:scenarios() |
Example
scenarios = gerter:scenarios() -- 1200
Agents
| Method | Type | Syntax |
|---|---|---|
| Agents | vector of strings | attribute = exp:agents() |
| Agents Size | number | attribute = exp:agents_size() |
| Agent | string | attribute = exp:agent(index) |
Example
[info] Thermal 1 at index 1
[info] Thermal 2 at index 2
[info] Thermal 3 at index 3
agents = gerter:agents() -- {"Thermal 1", "Thermal 2", "Thermal 3"}
for i, agent in ipairs(agents) do
    info(agent .. " at index " .. i);
end
size = gerter:agents_size() -- 3
for i = 1,size do
    agent = gerter:agent(i);
    info(agent .. " at index " .. i);
end
Unit
| Method | Type | Syntax |
|---|---|---|
| Unit | string | attribute = exp:unit() |
Example
unit = gerter:unit() -- "GWh"
Collections
| Collection | Constructor | Enumerate |
|---|---|---|
| Area | Area() |
Collection.AREA |
| Balancing Area | BalancingArea() |
Collection.BALANCING_AREA |
| Balancing Area Hydro | BalancingAreaHydro() |
Collection.BALANCING_AREA_HYDRO |
| Balancing Area Thermal | BalancingAreaThermal() |
Collection.BALANCING_AREA_THERMAL |
| Battery | Battery() |
Collection.BATTERY |
| Bus | Bus() |
Collection.BUS |
| Circuit | Circuit() |
Collection.CIRCUIT |
| Circuits Sum | CircuitsSum() |
Collection.CIRCUITS_SUM |
| DC Link | DCLink() |
Collection.DCLINK |
| Demand | Demand() |
Collection.DEMAND |
| Demand Segment | DemandSegment() |
Collection.DEMAND_SEGMENT |
| Expansion Capacity | ExpansionCapacity() |
Collection.EXPANSION_CAPACITY |
| Expansion Project | ExpansionProject() |
Collection.EXPANSION_PROJECT |
| Fuel | Fuel() |
Collection.FUEL |
| Fuel Consumption | FuelConsumption() |
Collection.FUEL_CONSUMPTION |
| Fuel Contract | FuelContract() |
Collection.FUEL_CONTRACT |
| Fuel Reservoir | FuelReservoir() |
Collection.FUEL_RESERVOIR |
| Generator | Generator() |
Collection.GENERATOR |
| Generation Constraint | GenerationConstraint() |
Collection.GENERATION_CONSTRAINT |
| Generic | Generic() |
--- |
| Hydro | Hydro() |
Collection.HYDRO |
| Interconnection | Interconnection() |
Collection.INTERCONNECTION |
| Interconnection Sum | InterconnectionSum() |
--- |
| Power Injection | PowerInjection() |
Collection.POWERINJECTION |
| Renewable | Renewable() |
Collection.RENEWABLE |
| Renewable Gauging Station | RenewableGaugingStation() |
Collection.RENEWABLE_GAUGING_STATION |
| Reserve Generation Constraint | ReserveGenerationConstraint() |
Collection.RESERVE_GENERATION_CONSTRAINT |
| Study | Study() |
--- |
| System | System() |
Collection.SYSTEM |
| Thermal | Thermal() |
Collection.THERMAL |
Loading an Output
| Operator | Syntax |
|---|---|
| Load method | output = collection:load("filename") |
The generic collection can load any output with any agent type.
Example
The following example loads two outputs, `gerhid and fprodt, considering the agents as hydro plants collection:
hydro = Hydro();
gerhid = hydro:load("gerhid");
fprodt = hydro:load("fprodt");
Example
The following example loads two outputs, cmgdem and demand, considering the agents as system collection:
system = System();
cmgdem = system:load("cmgdem");
demand = system:load("demand");
Example 3
The following example loads two outputs, gerter and coster, considering the agents as thermal plants collection:
thermal = Thermal();
gerter = thermal:load("gerter");
coster = thermal:load("coster");
Example 4
The following example loads two outputs, objcop and outdfact, considering the agents as generic:
generic = Generic();
objcop = generic:load("objcop");
outdfact = generic:load("outdfact");
Loading a Generic CSV
| Operator | Syntax |
|---|---|
| Load table method | table = study:load_table("filename.csv") |
The following example loads a generic csv table and iterates through the rows:
Example
file.csv:
Name         , Node, Interval, Startup, Participation
H_1_1        , 1   , 1       , 1      , 0.79
R_1_3        , 1   , 1       , 1      , 0.20
CONTRATO_FLAT, 1   , 1       , 1      , 1
script:
study = Study();
table = study:load_table("file.csv");

info("Name,Node,Interval,Startup,Participation");
for i=1,#table do
    info(
        table[i]["Name"] .. "," ..
        table[i]["Node"] .. "," ..
        table[i]["Interval"] .. "," ..
        table[i]["Startup"] .. "," ..
        table[i]["Participation"]
    );
end
Loading an Input
- Area
- Battery
- Bus
- Circuit
- Demand
- Demand Segment
- Fuel
- Gauging Station
- Hydro
- Interconnection
- Power Injection
- Renewable
- Renewable Gauging Station
- System
- Thermal
Area
| Data | Unit |
|---|---|
area.code |
--- |
area.imported |
MW |
area.exported |
MW |
Battery
| Data | Unit |
|---|---|
battery.code |
--- |
battery.state |
--- |
battery.capacity |
MW |
Bus
| Data | Unit |
|---|---|
bus.code |
--- |
bus.voltage_level |
kV |
Circuit
| Data | Unit |
|---|---|
circuit.code |
--- |
circuit.state |
--- |
circuit.resistance |
% |
circuit.reactance |
% |
circuit.capacity |
MW |
circuit.emergency_capacity |
MW |
circuit.DLR_factor |
pu |
circuit.monitored |
--- |
circuit.monitored_contingencies |
--- |
circuit.is_dc |
--- |
circuit.international_cost_right |
$/MWh |
circuit.international_cost_left |
$/MWh |
DC Link
| Data | Unit |
|---|---|
dclink.code |
--- |
dclink.state |
--- |
dclink.capacity_right |
MW |
dclink.capacity_left |
MW |
Demand
| Data | Unit |
|---|---|
demand.code |
--- |
demand.is_elastic |
--- |
demand.inelastic_hour |
MW |
demand.inelastic_block |
GWh |
demand.is_flexible |
--- |
demand.max_increase |
pu |
demand.max_decrease |
pu |
demand.curtailment_cost |
$/MWh |
demand.max_curtailment |
pu |
Demand Segment
| Data | Unit |
|---|---|
demand_segment.hour |
MW |
demand_segment.block |
GWh |
Fuel
| Data | Unit |
|---|---|
fuel.code |
--- |
fuel.cost |
$/gal |
fuel.emission_factor |
tCO2/MWh |
Gauging Station
| Data | Unit |
|---|---|
gauging_station.code |
--- |
gauging_station.inflow |
m3/s |
gauging_station.forward |
m3/s |
gauging_station.backward |
m3/s |
gauging_station.hour_inflow_historical_scenarios_nodata |
--- |
gauging_station.hour_inflow_historical_scenarios |
m3/s |
gauging_station.hour_inflow |
m3/s |
Hydro
| Data | Unit |
|---|---|
hydro.code |
--- |
hydro.state |
--- |
hydro.units |
--- |
hydro.system |
--- |
hydro.max_generation |
MW |
hydro.max_generation_available |
MW |
hydro.forced_outage_rate |
% |
hydro.historical_outage_factor |
% |
hydro.min_storage |
hm3 |
hydro.max_storage |
hm3 |
hydro.min_turbining_outflow |
m3/s |
hydro.max_turbining_outflow |
m3/s |
hydro.om_cost |
$/MWh |
hydro.irrigation |
m3/s |
hydro.min_total_outflow_modification |
m3/s |
hydro.target_storage_tolerance |
% |
hydro.disconsider_in_stored_and_inflow_energy |
--- |
hydro.mean_production_coefficient |
MW/(m3/s) |
hydro.loss_factor |
pu |
hydro.min_total_outflow |
m3/s |
hydro.min_total_outflow_penalty |
k$/m3/s |
hydro.min_total_outflow_penalty_type |
--- |
hydro.max_total_outflow |
m3/s |
hydro.max_total_outflow_penalty |
k$/m3/s |
hydro.max_total_outflow_penalty_type |
--- |
hydro.min_operative_storage |
hm3 |
hydro.min_operative_storage_penalty |
k$/hm3 |
hydro.min_operative_storage_penalty_type |
--- |
hydro.max_operative_storage |
hm3 |
hydro.max_operative_storage_penalty |
k$/hm3 |
hydro.max_operative_storage_penalty_type |
--- |
hydro.flood_control |
hm3 |
hydro.alert_storage |
hm3 |
hydro.alert_storage_penalty |
k$/hm3 |
hydro.alert_storage_penalty_type |
--- |
hydro.min_spillage |
m3/s |
hydro.min_spillage_penalty |
k$/m3/s |
hydro.min_spillage_penalty_type |
--- |
hydro.max_spillage |
m3/s |
hydro.max_spillage_penalty |
k$/m3/s |
hydro.max_spillage_penalty_type |
--- |
hydro.min_bio_spillage |
% |
hydro.min_bio_spillage_penalty |
k$/hm3 |
hydro.min_bio_spillage_penalty_type |
--- |
hydro.target_storage |
hm3 |
hydro.max_turbining |
m3/s |
hydro.max_turbining_penalty |
k$/m3/s |
hydro.max_turbining_penalty_type |
--- |
hydro.min_turbining_penalty |
k$/m3/s |
hydro.min_turbining_penalty_type |
--- |
hydro.spinning_reserve |
% |
hydro.max_reserve |
MW |
Interconnection
| Data | Unit |
|---|---|
interconnection.code |
--- |
interconnection.state |
--- |
interconnection.capacity_right |
MW |
interconnection.capacity_left |
MW |
interconnection.cost_right |
$/MWh |
interconnection.cost_left |
$/MWh |
Power Injection
| Data | Unit |
|---|---|
power_injection.code |
--- |
power_injection.hour_capacity |
MW |
power_injection.hour_price |
$/MWh |
Renewable
| Data | Unit |
|---|---|
renewable.code |
--- |
renewable.state |
--- |
renewable.units |
--- |
renewable.tech_type |
--- |
renewable.capacity |
MW |
renewable.om_cost |
$/MWh |
renewable.hour_generation |
pu |
renewable.block_generation |
pu |
renewable.operation_factor |
pu |
Renewable Gauging Station
| Data | Unit |
|---|---|
renewable_gauging_station.code |
--- |
renewable_gauging_station.hour_generation |
pu |
renewable_gauging_station.block_generation |
pu |
renewable_gauging_station.hour_historical_generation |
pu |
System
System
| Data | Unit |
|---|---|
system.code |
--- |
system.load_level_length |
--- |
system.hour_block_map |
--- |
system.sensitivity |
--- |
Thermal
| Data | Unit |
|---|---|
thermal.code |
--- |
thermal.state |
--- |
thermal.units |
--- |
thermal.system |
--- |
thermal.min_generation |
MW |
thermal.min_generation_available |
MW |
thermal.min_generation_constraint |
MW |
thermal.max_generation |
MW |
thermal.max_generation_available |
MW |
thermal.forced_outage_rate |
% |
thermal.historical_outage_factor |
% |
thermal.startup_cost |
k$ |
thermal.om_cost |
$/MWh |
thermal.specific_consumption_segment_1 |
gal/MWh |
thermal.specific_consumption_segment_2 |
gal/MWh |
thermal.specific_consumption_segment_3 |
gal/MWh |
thermal.fuel_transportation_cost |
$/gal |
thermal.operation_mode |
--- |
thermal.forced_generation |
MW |
thermal.emission_coefficient |
pu |
thermal.ramp_up |
MW/min |
thermal.ramp_down |
MW/min |
thermal.min_uptime |
hour |
thermal.min_downtime |
hour |
thermal.max_startups |
--- |
thermal.max_shutdowns |
--- |
thermal.shutdown_cost |
k$ |
thermal.alternative_fuel |
--- |
Expressions
Unary Expressions
PSRIO provides four unary operators that only receive one expression and does not modify any dimension (stages, blocks, scenarios, or agents). The unary minus maps the data values to their additive inverses; the absolute value is the non-negative value of the data without regard to its sign; the round method rounds the data to the specified number of digits after the decimal separator; the convert method determines the unit of the data.
| Operator | Syntax |
|---|---|
| Unary Minus | exp = -exp1 |
| Absolute Value | exp = exp1:abs() |
| Round | exp = exp1:round(int) |
| Convert | exp = exp1:convert(string) |
| Fill | exp = exp1:fill(double) |
Example
The example below takes the power flow in a circuit and calculates its absolute values.
circuit = Circuit();
cirflw = circuit:load("cirflw");

abs_cirflw = cirflw:abs();
Example
Here, we use the convert method to act over the generation data of a set of thermal plants given in GWh and convert it to MW.
thermal = Thermal();
thermal_gen = circuit:load("gerter");

converted_thermal_gen = thermal_gen:convert("MW");
Binary Expressions
PSRIO provides binary operators which can change attributes (stages, blocks, scenarios, and agents) depending on inputs. The first table presents the supported arithmetic operators.
| Operator | Syntax |
|---|---|
| Addition | exp = exp1 + exp2 |
| Subtraction | exp = exp1 - exp2 |
| Multiplication | exp = exp1 * exp2 |
| Right Division | exp = exp1 / exp2 |
| Power | exp = exp1 ^ exp2 |
The second table defines the logical and comparison operators.
| Operator | Syntax |
|---|---|
| Equal to | exp = exp1:eq(exp2) |
| Not Equal to | exp = exp1:ne(exp2) |
| Less-than | exp = exp1:lt(exp2) |
| Less-than-or-equals to | exp = exp1:le(exp2) |
| Greater-than | exp = exp1:gt(exp2) |
| Greater-than-or-equals to | exp = exp1:ge(exp2) |
| And | exp = exp1 & exp2 |
| Or | exp = exp1 | exp2 |
The third table defines two element-wise max and min methods between the two data arguments.
| Operator | Syntax |
|---|---|
| Maximum | exp = max(exp1, exp2) |
| Minimum | exp = min(exp1, exp2) |
Here are some examples of binary expressions.
Example
Calculating the useful storage of a hydro plant:
hydro = Hydro();
useful_storage = hydro.max_storage - hydro.min_storage;
Example
Comparing the generation of a thermal plant with its maximum capacity:
thermal = Thermal();

thermal_gen = thermal:load("gerter");
thermal_cap = thermal:load("potter");

gen_gt_cap = thermal_gen:convert("MW"):gt(thermal_cap);
Note that, since the generation data is in GWh and the capacity in MW, a unit conversion is needed to compare them.
Example
Getting the highest total generated energy per type of plant:
thermal = Thermal();
hydro = Hydro();

gerter = thermal:load("gerter");
gerhid = hydro:load("gerhid");

total_gerter = gerter:aggregate_agents(BY_SUM(), "Total Thermal Gen");
total_gerhid = gerhid:aggregate_agents(BY_SUM(), "Total Hydro Gen");

max_generation =  max(total_gerter, total_gerhid);
Thermal and hydro generation are not directly compared. To compare them, we first need to aggregate the agents to obtain only one representative agent containing generation per block, scenario, and stage in each data set. Then, we can compare them.
All the above-mentioned binary expressions follow the same rules to define the resulting output's stages, scenarios, blocks, and agents.
Stages and Scenarios
If one expression has n stages, and the other has only 1, the result will have n stages. If the exp1 has n1 stages and exp2 has n2, the resulting expression will have n3 as the minimum number of stages between the two. In other words, n3 = min{n1, n2}. If both expressions have 1 stage, the result will naturally have also 1. The same rule is applied to the scenarios. The table below summarizes the explanation:
| exp1 | exp2 | exp |
|---|---|---|
1 |
1 |
1 |
n1 |
1 |
n1 |
1 |
n2 |
n2 |
n1 |
n2 |
min{n1,n2} |
Block and Hours
The following table describes the blocks and hours rules. The only operation that is not allowed is mixing expressions that vary per block and hour.
| exp1 or exp2 | exp |
|---|---|
| none / none | none |
| block / none | block |
| block / block | block |
| hour / none | hour |
| hour / hour | hour |
| block / hour | ❌ |
Ternary Expressions
The table below presents the ifelse. Likewise, the above-defined operators, the ifelse follow dataframe rules, doing element-wise operations. If the element of exp1 is true, exp2 is the result, otherwise, it is exp3.
| Operator | Syntax |
|---|---|
| Conditional | exp = ifelse(exp1, exp2, exp3) |
Example
In the example below, if the thermal generation is greater than zero, 1 is returned; otherwise, 0 is returned.
thermal = Thermal();

gerter = thermal:load("gerter");

gerter_gt_zero = ifelse(gerter:gt(0.0), 1, 0);
Unit Conversion

The units conversion follows the International System of Units (SI), based on the 2019 redefinition. The PSRIO will perform a multi-step process with all the expressions inputs, producing a conversion factor with the desired unit.
| Operator | Syntax |
|---|---|
| Unit Conversion | exp = exp1:convert("unit") |
Example
hydro = Hydro();
fprodt = hydro:load("fprodt");

pothid = min(hydro.max_turbining_outflow * fprodt, hydro.max_generation_available);
In this example we have two inputs with different units: hydro.max_turbining_outflow [m3/s] and fprodt [MW/(m3/s)]. The pothid output will be the multiplication: [m3/s] × [MW/(m3/s)] = 1.0 × [MW].
Example
renewable = Renewable();
gergnd = renewable:load("gergnd");
vergnd = renewable:load("vergnd");

captured_prices = (gergnd * vergnd) / (gergnd + vergnd);
The unit conversion output of Example 2 is ([GWh] × [GWh]) / ([GWh] + [GWh]) = 1.0 × [GWh]
Example
thermal = Thermal();
fuel = Fuel();

cinte1 = (thermal.specific_consumption_segment_1 * (thermal.transport_cost + fuel.cost) + thermal.om_cost);
The unit conversion output of Example 3 is [gal/MWh] × ([$/gal] + [$/gal]) + [$/MWh] = 1.0 × [$/MWh]
Example 4
hydro = Hydro();
volfin = hydro:load("volfin");
fprodtac = hydro:load("fprodtac");

eneemb = ((volfin - hydro.min_storage) * fprodtac):convert("GWh");
The unit conversion output of Example 4 is ([hm3] - [hm3]) × [MW/(m3/s)] = 0.27 × [GWh]
Dimensions
Aggregate Functions
When analyzing simulation outputs, we are often interested in finding one single value that represents a set. PSRIO provides a set of methods to accomplish this kind of task with a high level of abstraction, the [aggregate functions][aggregate-functions]. One can choose many forms of how the output values will be aggregated. The table below shows the options offered by PSRIO:
| Aggregate Functions | Description |
|---|---|
BY_SUM() |
Sums the elements of a set |
BY_AVERAGE() |
Takes the average of the elements of a set |
BY_MAX() |
Selects the maximum value of a set |
BY_MIN() |
Selects the minimum value of a set |
BY_CVAR_L(number) |
Calculates the expected shortfall for the left-tail case with the specified probability in % |
BY_CVAR_R(number) |
Calculates the expected shortfall for the right-tail case with the specified probability in % |
BY_PERCENTILE(number) |
Returns the score associated with the specified percentile |
BY_NTH_ELEMENT(number) |
Takes the specified nth value of a set |
BY_STDDEV() |
Calculates standard deviation of a set |
BY_FIRST_VALUE() |
Takes the first value of a set |
BY_LAST_VALUE() |
Takes the last value of a set |
The methods above are only specifying how the methods will execute the aggregations. The aggregation itself is carried out by other methods, which are described in the sections below.
Dimensions: Scenarios
Aggregate Scenarios
$$ \operatorname{exp}=\operatorname{exp1:aggregate\_scenarios}(\operatorname{f}); $$
Example
system = System();
cmgdem = system:load("cmgdem");
cmgdem_avg = cmgdem:aggregate_scenarios(BY_AVERAGE());
cmgdem_p90 = cmgdem:aggregate_scenarios(BY_PERCENTILE(90));
Aggregate Selected Scenarios
$$ \operatorname{exp}=\operatorname{exp1:aggregate\_scenarios}(\operatorname{f}, \{\operatorname{int}, \operatorname{int}, ...\}); $$
Example
system = System();
cmgdem = system:load("cmgdem");
cmgdem_max = cmgdem:aggregate_scenarios(BY_MAX(), {1, 2, 3, 4, 5});
Select One Scenario
$$ \operatorname{exp}=\operatorname{exp1:select\_scenario}(\operatorname{int}); $$
Example
system = System();
cmgdem = system:load("cmgdem");
cmgdem_scenario32 = cmgdem:select_scenario(32);
Select Multiple Scenarios
$$ \operatorname{exp}=\operatorname{exp1:select\_scenarios}(\{\operatorname{int}, \operatorname{int}, ...\}); $$
Remove Multiple Scenarios
$$ \operatorname{exp}=\operatorname{exp1:remove\_scenarios}(\{\operatorname{int}, \operatorname{int}, ...\}); $$
Dimensions: Blocks/Hours
Aggregate Blocks/Hours
$$ \operatorname{exp}=\operatorname{exp1:aggregate\_blocks}(\operatorname{f}); $$
Example
system = System();
cmgdem = system:load("cmgdem");
cmgdem_agg = cmgdem:aggregate_blocks(BY_AVERAGE());

renewable = Renewable();
gergnd = renewable:load("gergnd");
gergnd_agg = gergnd:aggregate_blocks(BY_SUM());
Select One Block/Hour
$$ \operatorname{exp}=\operatorname{exp1:select\_block}(\operatorname{int}); $$
Example
system = System();
cmgdem = system:load("cmgdem");
cmgdem_block21 = cmgdem:select_block(21);
Map Blocks into Hours
$$ \operatorname{exp}=\operatorname{exp1:to\_hour}(\operatorname{f}); $$
Where f is BY_AVERAGE() or BY_REPEATING().
Example
system = System();
cmgdem_block = thermal:load("cmgdem");
cmgdem_hourly = cmgdem_block:to_hour(BY_REPEATING());
Map Hours into Blocks
$$ \operatorname{exp}=\operatorname{exp1:to\_block}(\operatorname{f}); $$
Where f is BY_AVERAGE() or BY_SUM().
Example
thermal = Thermal();
gerter_hourly = thermal:load("gerter");
gerter_block = gerter_hourly:to_block(BY_SUM());
Dimensions: Stages
Aggregate Stages
$$ \operatorname{exp}=\operatorname{exp1:aggregate\_stages}(\operatorname{f}); $$
Aggregate Stages into a Profile
$$ \operatorname{exp}=\operatorname{exp1:aggregate\_stages}(\operatorname{f}, \operatorname{profile}); $$
Where profile is the following enumerate:
| Profiles |
|---|
Profile.STAGE |
Profile.WEEK |
Profile.MONTH |
Profile.QUARTER |
Profile.YEAR |
Profile.PER_WEEK |
Profile.PER_MONTH |
Profile.PER_QUARTER |
Profile.PER_YEAR |
Profile.STAGE
The Profile.STAGE is the default value to characterize the aggregation if the user does not inform any profile. The data associated with each stage of the study horizon is aggregated.
| exp1 | exp (Profile.STAGE) |
|---|---|
n (daily) |
1 (daily) |
n (weekly) |
1 (weekly) |
n (monthly) |
1 (monthly) |
n (yearly) |
1 (yearly) |
Profile.WEEK and Profile.PER_WEEK
When the data has a daily resolution and the aggregation profile is Profile.WEEK, PSRIO will aggregate the data for each day of the weeks in the study period, i.e., that data regarding all Mondays in the data set will be aggregated into one value and the same for Tuesday, Wednesday, and so on. With a daily resolution and the aggregation Profile.PER_WEEK, PSRIO will aggregate the data related to each week of the study.
When the data is weekly and we request is Profile.WEEK, the data associated with each week is aggregated in one week. If the request is the aggregation Profile.PER_WEEK, PSRIO will do nothing and the data will remains the same.
These aggregation profiles are not defined for monthly and yearly resolution data.
| exp1 | exp (Profile.WEEK) |
exp (Profile.PER_WEEK) |
|---|---|---|
n (daily) |
7 (daily) |
n/7 (weekly) |
n (weekly) |
1 (weekly) |
n (weekly) |
n (monthly) |
❌ | ❌ |
n (yearly) |
❌ | ❌ |
Example
system = System();
cmgdem = system:load("cmgdem");
cmgdem_agg = cmgdem:aggregate_blocks(BY_AVERAGE(), profile.WEEK);
Example
system = System();
cmgdem = system:load("cmgdem");
cmgdem_agg = cmgdem:aggregate_blocks(BY_AVERAGE(), profile.PER_WEEK);
Profile.MONTH and Profile.PER_MONTH
Similar to Profile.WEEK and Profile.PER_WEEK, when the data has daily discretization and we request Profile.MONTH, PSRIO will aggregate the data for each day of the months in the study period. For example, PSRIO will aggregate all 1st days of each month and the same for the others months. If we request the Profile.PER_MONTH, PSRIO will aggregate the data related to each month.
When the data has month-level discretization and we request Profile.MONTH, PSRIO will aggregate the data associated with each month. If we request Profile.PER_MONTH, nothing is done to the data.
These aggregation profiles are not defined for weekly and yearly resolution data.
| exp1 | exp (Profile.MONTH) |
exp (Profile.PER_MONTH) |
|---|---|---|
n (daily) |
31 (daily) |
n/~30 (monthly) |
n (weekly) |
❌ | ❌ |
n (monthly) |
1 (monthly) |
n (monthly) |
n (yearly) |
❌ | ❌ |
Example
system = System();
cmgdem = system:load("cmgdem");
cmgdem_agg = cmgdem:aggregate_blocks(BY_AVERAGE(), profile.MONTH);
Example
system = System();
cmgdem = system:load("cmgdem");
cmgdem_agg = cmgdem:aggregate_blocks(BY_AVERAGE(), profile.PER_MONTH);
Profile.YEAR and Profile.PER_YEAR
When the data has a daily resolution and we request a Profile.YEAR, the data related to each day of years is aggregated. For example, PSRIO will aggregate all January 1st days in the study period, which is done for the other days of the year. If we request a Profile.PER_YEAR, the data associated with each year is aggregated. The same happens when the data has week, month, or year-level resolution if Profile.PER_YEAR is selected.
If the data has a year resolution and profile.YEAR is selected. the data related to the same year is aggregated.
The profile.YEAR profile is not defined for weekly and monthly resolution data.
| exp1 | exp (Profile.YEAR) |
exp (Profile.PER_YEAR) |
|---|---|---|
n (daily) |
365 (daily) |
n/365 (yearly) |
n (weekly) |
52 (weekly) |
n/52 (yearly) |
n (monthly) |
12 (monthly) |
n/12 (yearly) |
n (yearly) |
1 (yearly) |
1 (yearly) |
Example
system = System();
defcit = system:load("defcit");
defcit_per_year = defcit:aggregate_stages(BY_SUM(), Profile.YEAR);
Example
system = System()
defcit = system:load("defcit")
defcit_per_year = defcit:aggregate_stages(BY_SUM(), Profile.PER_YEAR);
Select One Stage
$$ \operatorname{exp}=\operatorname{exp1:select\_stage}(\operatorname{int}); $$
generic = Generic();
objcop = generic:load("objcop");
objcop_1st_stage = objcop:select_stage(1);
Select the First Stage
$$ \operatorname{exp}=\operatorname{exp1:select\_first\_stage}(\operatorname{int}); $$
generic = Generic();
objcop = generic:load("objcop");
objcop_2nd_to_n_stage = objcop:select_first_stage(2);
Select the Last Stage
$$ \operatorname{exp}=\operatorname{exp1:select\_last\_stage}(\operatorname{int}); $$
generic = Generic();
objcop = generic:load("objcop");
objcop_1st_to_2nd_stage = objcop:select_last_stage(2);
Select the First and the Last Stages
$$ \operatorname{exp}=\operatorname{exp1:select\_stages}(\operatorname{int}, \operatorname{int}); $$
generic = Generic();
objcop = generic:load("objcop");
objcop_2nd_to_4th_stage = objcop:select_stages(2, 4);
Select Stages by a First and a Last Years
$$ \operatorname{exp}=\operatorname{exp1:select\_stages\_by\_year}(\operatorname{int}, \operatorname{int}); $$
generic = Generic();
objcop = generic:load("objcop");
objcop_2030_2040 = objcop:select_stages_by_year(2030, 2040);
Select Stages by a Year
$$ \operatorname{exp}=\operatorname{exp1:select\_stages\_by\_year}(\operatorname{int}); $$
generic = Generic();
objcop = generic:load("objcop");
objcop_2035 = objcop:select_stages_by_year(2035);
Reshape Stages
$$ \operatorname{exp}=\operatorname{exp1:reshape\_stages}(\operatorname{Profile.DAILY}); $$
For an hourly represented data, the stage resolution can changed from a week, month or year level to a daily one using that method
| exp1 | exp |
|---|---|
n (daily-hourly) |
n (daily-hourly) |
n (weekly-hourly) |
7n (daily-hourly) |
n (monthly-hourly) |
~30n (daily-hourly) |
n (yearly-hourly) |
365n (daily-hourly) |
Example
thermal = Thermal();
gerter = thermal:load("gerter");
gerter_daily = gerter:reshape_stages(Profile.DAILY);
Dimensions: Agents
Aggregate All Agents
$$ \operatorname{exp}=\operatorname{exp1:aggregate\_agents}(\operatorname{f}, \operatorname{string}); $$
Example
hydro = Hydro();
gerhid = hydro:load("gerhid");
gerhid_sum = gerhid:aggregate_agents(BY_SUM(), "Total Hydro");
Aggregate Agents into Collection
$$ \operatorname{exp}=\operatorname{exp1:aggregate\_agents}(\operatorname{f}, \operatorname{collection}); $$
Where collection is Collection Enumerate.
Example
hydro = Hydro();
gerhid = hydro:load("gerhid");
gerhid_systems = gerhid:aggregate_agents(BY_SUM(), Collection.SYSTEM);
gerhid_buses = gerhid:aggregate_agents(BY_SUM(), Collection.BUSES);
Select One Agent by Name or Index
$$ \operatorname{exp}=\operatorname{exp1:select\_agent}(\text{string or int}); $$
Example
thermal = Thermal();
gerter = thermal:load("gerter");
gerter_t1 = gerter:select_agent("Thermal 1");
gerter_t2 = gerter:select_agent(2);
Select Mulitple Agents by Names or Indices
$$ \operatorname{exp}=\operatorname{exp1:select\_agents}(\{\text{string or int}, \text{string or int}, ...\}); $$
Example
thermal = Thermal();
gerter = thermal:load("gerter");
gerter_t1_and_t2 = gerter:select_agents({"Thermal 1", 2});
Select Agents within a Collection
$$ \operatorname{exp}=\operatorname{exp1:select\_agents}(\operatorname{collection}); $$
Where collection is Collection Enumerate.
Example
expansion_project = ExpansionProject()
outidec = expansion_project:load("outidec");
outidec_dclinks = outidec:select_agents(Collection.DCLINK);
Select Agents with a Query
$$ \operatorname{exp}=\operatorname{exp1:select\_agents}(\operatorname{string}); $$
Example
thermal = Thermal();
gerter = thermal:load("gerter");
non_zero_gerter = gerter:select_agents(gerter:ne(0));
Remove One Agent by Name or Index
$$ \operatorname{exp}=\operatorname{exp1:remove\_agent}(\text{string or int}); $$
Example
thermal = Thermal();
gerter = thermal:load("gerter");
gerter_t2_and_t3 = gerter:remove_agent("Thermal 1");
gerter_t1_and_t2 = gerter:remove_agent(3);
Remove Mulitple Agents by Names or Indices
$$ \operatorname{exp}=\operatorname{exp1:remove\_agents}(\{\text{string or int}, \text{string or int}, ...\}); $$
Example
thermal = Thermal();
gerter = thermal:load("gerter");
gerter_t1 = gerter:remove_agents({"Thermal 2", 3});
Rename One Agent
$$ \operatorname{exp}=\operatorname{exp1:rename\_agent}(\text{string}); $$
Rename Mulitple Agents with One Name
$$ \operatorname{exp}=\operatorname{exp1:rename\_agents}(\text{string}); $$
Rename Mulitple Agents with Mutiple Names
$$ \operatorname{exp}=\operatorname{exp1:rename\_agents}(\{\text{string}, \text{string}, ...\}); $$
Example
thermal = Thermal();
gerter = thermal:load("gerter");
gerter_renamed = gerter:rename_agents({"T1", "T2", "T3"});
Rename Mulitple Agents by Adding a Suffix
$$ \operatorname{exp}=\operatorname{exp1:add\_suffix}(\text{string}); $$
Rename Mulitple Agents by Adding a Prefix
$$ \operatorname{exp}=\operatorname{exp1:add\_prefix}(\text{string}); $$
Concatenate Agents
$$ \operatorname{exp}=\operatorname{concatenate}(\{\operatorname{exp1}, \operatorname{exp2}, ...\}); $$
Example 1
hydro = Hydro();
thermal = Thermal();
renewable = Renewable();

gerhid = hydro:load("gerhid");
gerter = thermal:load("gerter");
gergnd = renewable:load("gergnd");
generation = concatenate(gerhid, gerter, gergnd);
Dimensions: Others
Moving Function
$$ \operatorname{exp}=\operatorname{exp1:moving}(\operatorname{f}, \operatorname{int}); $$
Example
system = System();
cmgdem = system:load("cmgdem");
cmgdem_12months = cmgdem:moving(BY_AVERAGE(), 12);
Saving
Save Options
| Description | Syntax | Default |
|---|---|---|
| Save output as BIN/HDR | bin |
true |
| Save output as CSV | csv |
false |
| Save output as DAT | dat |
false |
Save
$$ \operatorname{exp1:save}(\operatorname{string}); $$
Example
thermal = Thermal();
gerter = thermal:load("gerter");
gerter:save("example");
Save with Options
$$ \operatorname{exp1:save}(\operatorname{string}, \{\operatorname{options}\}); $$
Example
thermal = Thermal();
gerter = thermal:load("gerter");
gerter:save("example", { csv = true });
Save and Load into an Expression
$$ \operatorname{exp}=\operatorname{exp1:save\_and\_load}(\operatorname{string}); $$
Example
thermal = Thermal();
gerter = thermal:load("gerter");
example = gerter:save_and_load("example");
Save with Options and Load into an Expression
$$ \operatorname{exp}=\operatorname{exp1:save\_and\_load}(\operatorname{string}, \{\operatorname{options}\}); $$
Example
thermal = Thermal();
gerter = thermal:load("gerter");
example = gerter:save_and_load("example", { csv = true });
Save Cache
$$ \operatorname{exp}=\operatorname{exp1:save\_cache}(); $$
Example
thermal = Thermal();
gerter = thermal:load("gerter");
cache = gerter:save_cache();
Dashboard
PSRIO provides a set of methods that allow users to analyze their results simply and easily.
Create a Tab
$$ \operatorname{tab}=\operatorname{Tab}(\text{string}); $$
Example
tab = Tab("Tab title");
Set the Tab Icon
$$ \operatorname{tab:set\_icon}(\text{string}); $$
Example
tab = Tab("Tab title");
tab:set_icon("home");
Push a Chart to a Tab
$$ \operatorname{tab:push}(\text{chart}); $$
Example
tab = Tab("Tab title");
tab:push("home");
Push a Markdown to a Tab
$$ \operatorname{tab:push}(\text{string}); $$
Example
tab = Tab("Tab title");
tab:push("# Heading 1");
Push a Tab to a Tab
$$ \operatorname{tab:push}(\text{tab}); $$
Example
tab = Tab("Tab title");
subtab = Tab("Sub Tab title");
tab:push(subtab);
Save a Tab
$$ \operatorname{tab:save}(\text{string}); $$
Example
tab = Tab("Tab title");
tab:save("example");
Create a Dashboard
$$ \operatorname{dashboard}=\operatorname{Dashboard}(); $$
Example
dashboard = Dashboard();
Push a Tab to a Dashboard
$$ \operatorname{dashboard:push}(\operatorname{tab}); $$
Example
tab = Tab("Tab title");
dashboard = Dashboard();
dashboard:push(tab);
Save a Dashboard
$$ \operatorname{dashboard:save}(\text{string}); $$
Example
dashboard = Dashboard();
dashboard:save("example");
Charts
Charts are the essential elements of dashboards. They provide a visual way of analyzing the data generated by PSR models. To create a chart object, we should use one of the following methods:
| Method | Syntax |
|---|---|
| Create a Chart | chart = Chart() |
| Create a Chart with a title | chart = Chart("title") |
| Create a Chart with a title and a subtitle | chart = Chart("title", "subtitle") |
After creating the chart object, we can start to push the data in it. PSRIO gives multiple options for chart types, which can be seen below:
| Method | Syntax |
|---|---|
| Line | chart:add_line(exp) |
| Spline | chart:add_spline(exp) |
| Column | chart:add_column(exp) |
| Column Stacking | chart:add_column_stacking(exp) |
| Column Percent | chart:add_column_percent(exp) |
| Categories | chart:add_categories(exp, "label") |
| Area | chart:add_area(exp) |
| Area Stacking | chart:add_area_stacking(exp) |
| Area Percent | chart:add_area_percent(exp) |
| Area Range | chart:add_area_range(exp1, exp2) |
| Area Spline | chart:add_area_spline(exp) |
| Area Spline Stacking | chart:add_area_spline_stacking(exp) |
| Area Spline Percent | chart:add_area_spline_percent(exp) |
| Area Spline Range | chart:add_area_spline_range(exp1, exp2) |
| Pie | chart:add_pie(exp) |
| Histogram | chart:add_histogram(exp) |
| Heatmap (Hourly) | chart:add_heatmap_hourly(exp) |
| Scatter | chart:add_scatter(exp1, exp2, "label") |
| Probability of Exceedance | chart:add_probability_of_exceedance(exp) |
Examples
local thermal = Thermal();
local gerter = thermal:load("gerter");

local hydro = Hydro();
local gerhid = hydro:load("gerhid");

local renewable = Renewable();
local gergnd = renewable:load("gergnd");

local tab = Tab("Tutorial");

-- push charts to tab here --

tab:save("tutorial");
Example: Line
local chart = Chart("Line");
chart:add_line(gerter:aggregate_blocks(BY_SUM()):aggregate_scenarios(BY_AVERAGE()):select_largest_agents(5));
tab:push(chart);
Example: Spline
local chart = Chart("Spline");
chart:add_spline(gerter:aggregate_blocks(BY_SUM()):aggregate_scenarios(BY_AVERAGE()):select_largest_agents(5));
tab:push(chart);
Example: Column
local chart = Chart("Column");
chart:add_column(gerter:aggregate_blocks(BY_SUM()):aggregate_scenarios(BY_AVERAGE()):select_largest_agents(5));
tab:push(chart);
Example: Categories
local chart = Chart("Categories");
chart:add_categories(gerter:aggregate_blocks(BY_SUM()):aggregate_scenarios(BY_AVERAGE()):aggregate_agents(BY_SUM(), Collection.SYSTEM), "Thermal");
chart:add_categories(gerhid:aggregate_blocks(BY_SUM()):aggregate_scenarios(BY_AVERAGE()):aggregate_agents(BY_SUM(), Collection.SYSTEM), "Hydro");
chart:add_categories(gergnd:aggregate_blocks(BY_SUM()):aggregate_scenarios(BY_AVERAGE()):aggregate_agents(BY_SUM(), Collection.SYSTEM), "Renewable");
tab:push(chart);
Example: Column Stacking
local chart = Chart("Column Stacking");
chart:add_column(gerter:aggregate_blocks(BY_SUM()):aggregate_scenarios(BY_AVERAGE()):select_largest_agents(5));
tab:push(chart);
Example: Column Percent
local chart = Chart("Column Percent");
chart:add_column(gerter:aggregate_blocks(BY_SUM()):aggregate_scenarios(BY_AVERAGE()):select_largest_agents(5));
tab:push(chart);
Example: Area
local chart = Chart("Area");
chart:add_area(gerter:aggregate_blocks(BY_SUM()):aggregate_scenarios(BY_AVERAGE()):select_largest_agents(5));
tab:push(chart);
Example: Area Stacking
local chart = Chart("Area Stacking");
chart:add_area_stacking(gerter:aggregate_blocks(BY_SUM()):aggregate_scenarios(BY_AVERAGE()):select_largest_agents(5));
tab:push(chart);
Example: Area Percent
local chart = Chart("Area Percent");
chart:add_area_percent(gerter:aggregate_blocks(BY_SUM()):aggregate_scenarios(BY_AVERAGE()):select_largest_agents(5));
tab:push(chart);
Example: Area Range
local chart = Chart("Area Range");
chart:add_area_range(
    gerter:aggregate_blocks(BY_SUM()):aggregate_scenarios(BY_PERCENTILE(10)):aggregate_agents(BY_SUM(), "p10"),
    gerter:aggregate_blocks(BY_SUM()):aggregate_scenarios(BY_PERCENTILE(90)):aggregate_agents(BY_SUM(), "p90")
);
tab:push(chart);
Example: Area Spline
local chart = Chart("Area Spline");
chart:add_area_spline(gerter:aggregate_blocks(BY_SUM()):aggregate_scenarios(BY_AVERAGE()):select_largest_agents(5));
tab:push(chart);
Example: Area Spline Stacking
local chart = Chart("Area Spline Stacking");
chart:add_area_spline_stacking(gerter:aggregate_blocks(BY_SUM()):aggregate_scenarios(BY_AVERAGE()):select_largest_agents(5));
tab:push(chart);
Example: Area Spline Percent
local chart = Chart("Area Spline Percent");
chart:add_area_spline_percent(gerter:aggregate_blocks(BY_SUM()):aggregate_scenarios(BY_AVERAGE()):select_largest_agents(5));
tab:push(chart);
Example: Area Spline Range
local chart = Chart("Area Spline Range");
chart:add_area_spline_range(
    gerter:aggregate_blocks(BY_SUM()):aggregate_scenarios(BY_PERCENTILE(10)):aggregate_agents(BY_SUM(), "p10"),
    gerter:aggregate_blocks(BY_SUM()):aggregate_scenarios(BY_PERCENTILE(90)):aggregate_agents(BY_SUM(), "p90")
);
tab:push(chart);
Example: Pie
local chart = Chart("Pie");
chart:add_pie(gerter:aggregate_blocks(BY_SUM()):aggregate_scenarios(BY_AVERAGE()):aggregate_stages(BY_SUM()));
tab:push(chart);
Example: Histogram
local chart = Chart("Histogram");
chart:add_histogram(gerter:aggregate_blocks(BY_SUM()):aggregate_agents(BY_SUM(), "Total"));
tab:push(chart);
Example: Probability of Exceedance
local chart = Chart("Probability of Exceedance");
chart:add_probability_of_exceedance(gerter:aggregate_blocks(BY_SUM()));
tab:push(chart);
Example: Multiple (Line and Area Range)
local chart = Chart("Multiple (Line and Area Range)");
chart:add_area_range(
    gerter:aggregate_blocks(BY_SUM()):aggregate_scenarios(BY_PERCENTILE(10)):aggregate_agents(BY_SUM(), "p10"),
    gerter:aggregate_blocks(BY_SUM()):aggregate_scenarios(BY_PERCENTILE(90)):aggregate_agents(BY_SUM(), "p90")
);
chart:add_line(
    gerter:aggregate_blocks(BY_SUM()):aggregate_scenarios(BY_AVERAGE()):aggregate_agents(BY_SUM(), "avg")
);
tab:push(chart);
Example: Multiple (Line and Column)
local chart = Chart("Multiple (Line and Column)");
chart:add_column(gerter:aggregate_blocks(BY_SUM()):aggregate_scenarios(BY_AVERAGE()):aggregate_agents(BY_SUM(), "column"));
chart:add_line(gerter:aggregate_blocks(BY_SUM()):aggregate_scenarios(BY_AVERAGE()):aggregate_agents(BY_SUM(), "line"));
tab:push(chart);
Chart Attributes
Some methods accept arguments to customize your chart, i.e., change its color, define the limits on the y axis, etc.
The arguments are declared in tables inside the methods, as shown in the following example:
chart:add_line(exp, {lineWidth = 2}). The user can also define multiple arguments as follows chart:add_line(exp, {lineWidth = 2, color = "#8583ff"}). The following table describes the available chart arguments:
| Argument | Description |
|---|---|
color = ? |
e.g. #ff0000 or red |
lineWidth = ? |
0, 1, 2, ... |
marker = {enabled = ?} |
true or false |
marker = {symbol = ?} |
circle, square, diamond, triangle or triangle-down |
marker = {radius = ?} |
0, 1, 2, ... |
dataLabels = {enabled = ?} |
true or false |
dataLabels = {format = ?} |
e.g. "{point.y:,.0f}" |
xGridLineWidth = ? |
0, 1, 2, ... |
fillOpacity = ? |
0.0 to 1.0 |
dashStyle = ? |
solid, shortdash, shortdot, shortdashdot, shortdashdotdot, dot, dash, longdash, dashdot, longdashdot, and longdashdotdo |
stops = { {?, ?}, ... } |
e.g. stops = {{0.0, "#3060cf"}, {0.5, "#fffbbc"}, {0.9, '#c4463a"}} |
showInLegend = ? |
true or false |
Examples
local system = System();
local cmgdem = system:load("cmgdem"):aggregate_scenarios(BY_AVERAGE());
local cmgdem_per_agent = cmgdem:aggregate_blocks(BY_AVERAGE());
local cmgdem_per_block = cmgdem:aggregate_agents(BY_SUM(), "Load Marginal Cost");
local cmgdem_aggregated = cmgdem:aggregate_blocks(BY_AVERAGE()):aggregate_agents(BY_SUM(), "Load Marginal Cost");

local tab = Tab("Tutorial");

-- push charts to tab here --

tab:save("tutorial");
Example: Single Color
local chart = Chart("Single Color");
chart:add_line(cmgdem_per_agent, {color = "#8583ff"});
tab:push(chart);
Example: Multiple Colors
local chart = Chart("Multiple Colors");
chart:add_line(cmgdem_per_agent, {color = {"#9b5de5", "#f15bb5", "#fee440", "#00bbf9", "#00f5d4"}});
tab:push(chart);
Example: Multiple Colors (interpolate)
local chart = Chart("Multiple Colors (interpolate)");
chart:add_line(cmgdem_per_agent, {color = PSR.interpolate_colors("#ff0000", "#00ff00", cmgdem_per_agent:agents_size())});
tab:push(chart);
Example: Line Width
local chart = Chart("Line Width");
chart:add_line(cmgdem_aggregated, {lineWidth = 8});
tab:push(chart);
Example: Marker
local chart = Chart("Marker");
chart:add_line(cmgdem_aggregated, {marker = {enabled = true, symbol = "circle", radius = 2}});
tab:push(chart);
Example: Data Labels
local chart = Chart("Data Labels");
chart:add_line(cmgdem_aggregated, {dataLabels = {enabled = true, format = "{point.y:,.0f}"} });
tab:push(chart);
Example: xGrid Line Width
local chart = Chart("xGrid Line Width");
chart:add_line(cmgdem_aggregated, {xGridLineWidth = 1});
tab:push(chart);
Example: Fill Opacity
local chart = Chart("Fill Opacity");
chart:add_area(cmgdem_aggregated, {fillOpacity = 1});
tab:push(chart);
Example: Dash Style
local chart = Chart("Dash Style");
chart:add_line(cmgdem_aggregated, {dashStyle = "dash"});
tab:push(chart);
Example: Show In Legend
local chart = Chart("Show In Legend");
chart:add_line(cmgdem_aggregated, {showInLegend = false});
tab:push(chart);
Markdown
Headers
# h1 Heading
## h2 Heading
### h3 Heading
#### h4 Heading
##### h5 Heading
###### h6 Heading
h1 Heading
h2 Heading
h3 Heading
h4 Heading
h5 Heading
h6 Heading
Horizontal Rules
___

---

***
Emphasis
*This text will be italic*
_This will also be italic_
**This text will be bold**
__This will also be bold__
*You **can** combine them*
~~This text will be strikethrough~~
This text will be italic
This will also be italic
This text will be bold
This will also be bold
You can combine them
This text will be strikethrough
Unordered List
+ Create a list by starting a line with `+`, `-`, or `*`
+ Sub-lists are made by indenting 2 spaces:
  - Marker character change forces new list start:
    * Ac tristique libero volutpat at
    + Facilisis in pretium nisl aliquet
    - Nulla volutpat aliquam velit
+ Very easy!
- Create a list by starting a line with
+,-, or* - Sub-lists are made by indenting 2 spaces:
- Marker character change forces new list start:
- Ac tristique libero volutpat at
- Facilisis in pretium nisl aliquet
- Nulla volutpat aliquam velit
- Marker character change forces new list start:
- Very easy!
Ordered List
1. Item 1
2. Item 2
3. Item 3
    * Item 3a
    * Item 3b
- Item 1
- Item 2
- Item 3
- Item 3a
- Item 3b
Links
[link text](http://psr-inc.com)

[link with tooltip](http://psr-inc.com/ "tooltip text!")

Autoconverted link http://psr-inc.com (enable linkify to see)
Autoconverted link http://psr-inc.com (enable linkify to see)
Blockquotes
> Blockquotes can also be nested...
>> ...by using additional greater-than signs right next to each other...
> > > ...or with spaces between arrows.
Blockquotes can also be nested...
...by using additional greater-than signs right next to each other...
...or with spaces between arrows.
Code
Inline `code`

    // Indented code
    line 1 of code
    line 2 of code
    line 3 of code

```
Block code
```
Inline code
// Indented code
line 1 of code
line 2 of code
line 3 of code
Block code
Tables
| Option | Description                                                               |
|--------|---------------------------------------------------------------------------|
| data   | path to data files to supply the data that will be passed into templates. |
| engine | engine to be used for processing templates. Handlebars is the default.    |
| ext    | extension to be used for dest files.                                      |
| Option | Description |
|---|---|
| data | path to data files to supply the data that will be passed into templates. |
| engine | engine to be used for processing templates. Handlebars is the default. |
| ext | extension to be used for dest files. |
Images


![Alt text][id]
[id]: https://octodex.github.com/images/dojocat.jpg "The Dojocat"


Equations
https://katex.org/docs/supported.html
dashboard:push("$$ x^2 + y^2 = z^2 $$");
$$ x^2 + y^2 = z^2 $$
dashboard:push("$$ \sqrt{x^2+1} $$");
$$ \sqrt{x^2+1} $$
dashboard:push("$$ \int\limits_0^1 x^2 + y^2 dx $$");
$$ \int\limits_0^1 x^2 + y^2 dx $$
dashboard:push("$$ \int_0^1 x^2 + y^2 dx $$");
$$ \int_0^1 x^2 + y^2 dx $$
dashboard:push("$$ a_1^2 + a_2^2 = a_3^2 $$");
$$ a_1^2 + a_2^2 = a_3^2 $$
dashboard:push("$$ \sum_{i=1}^{\infty} \frac{1}{n^s} = \prod_p \frac{1}{1 - p^{-s}} $$");
$$ \sum_{i=1}^{\infty} \frac{1}{n^s} = \prod_p \frac{1}{1 - p^{-s}} $$
dashboard:push("$$ \begin{matrix} a & b \\\\ c & d \end{matrix} $$");
$$ \begin{matrix} a & b \\ c & d \end{matrix} $$
Base
PSRIO Base is a library embedded with PSRIO that provides implementations of PSR model outputs. Instead of rewriting recipes or searching for written similar scripts, we can use the functions provided by PSRIO Base. We use the function require to load the scripts defined in the PSRIO Base.
Example: Useful Storage
(https://github.com/psrenergy/psrio-base/blob/master/sddp/useful_storage.lua):set_icon
useful_storage = require("sddp/useful_storage");
useful_storage():save("useful_storage");
Example: Circuit Loading
usecir = require("sddp/usecir");
usecir():save("usecir");
Example: Hydro Generation per Bus
gerhid_per_bus = require("sddp/gerhid_per_bus");
gerhid_per_bus():save("gerhid_per_bus");
Example: Deficit Risk per Year
defcit_risk = require("sddp/defcit_risk");
defcit_risk():save("defcit_risk");
Example: Load Marginal Cost Report
sddpcmgd = require("sddp-reports/sddpcmgd");
sddpcmgd():save("sddpcmgd");
Example: Averaged Load Marginal Cost Report
sddpcmga = require("sddp-reports/sddpcmga");
sddpcmga():save("sddpcmga");